New Version The Post Below Is Out Of Date Click Here For The New Version
This post is many months in the making and I am very proud of the thing’s I’ve done here, and very thankful to all of those (specifically at www.reddit.com/r/raspberry_pi) who have helped me along my way to getting this project up and running.
Let’s get this going, here’s an overview video:
There are 8 parts to this system and, you guessed it, I’ll be going in-depth about every single one!
Sensor Network
So at it’s core, the PiPlanter is a Sensor Network & Pump System. Here’s a video explaining the sensor array:
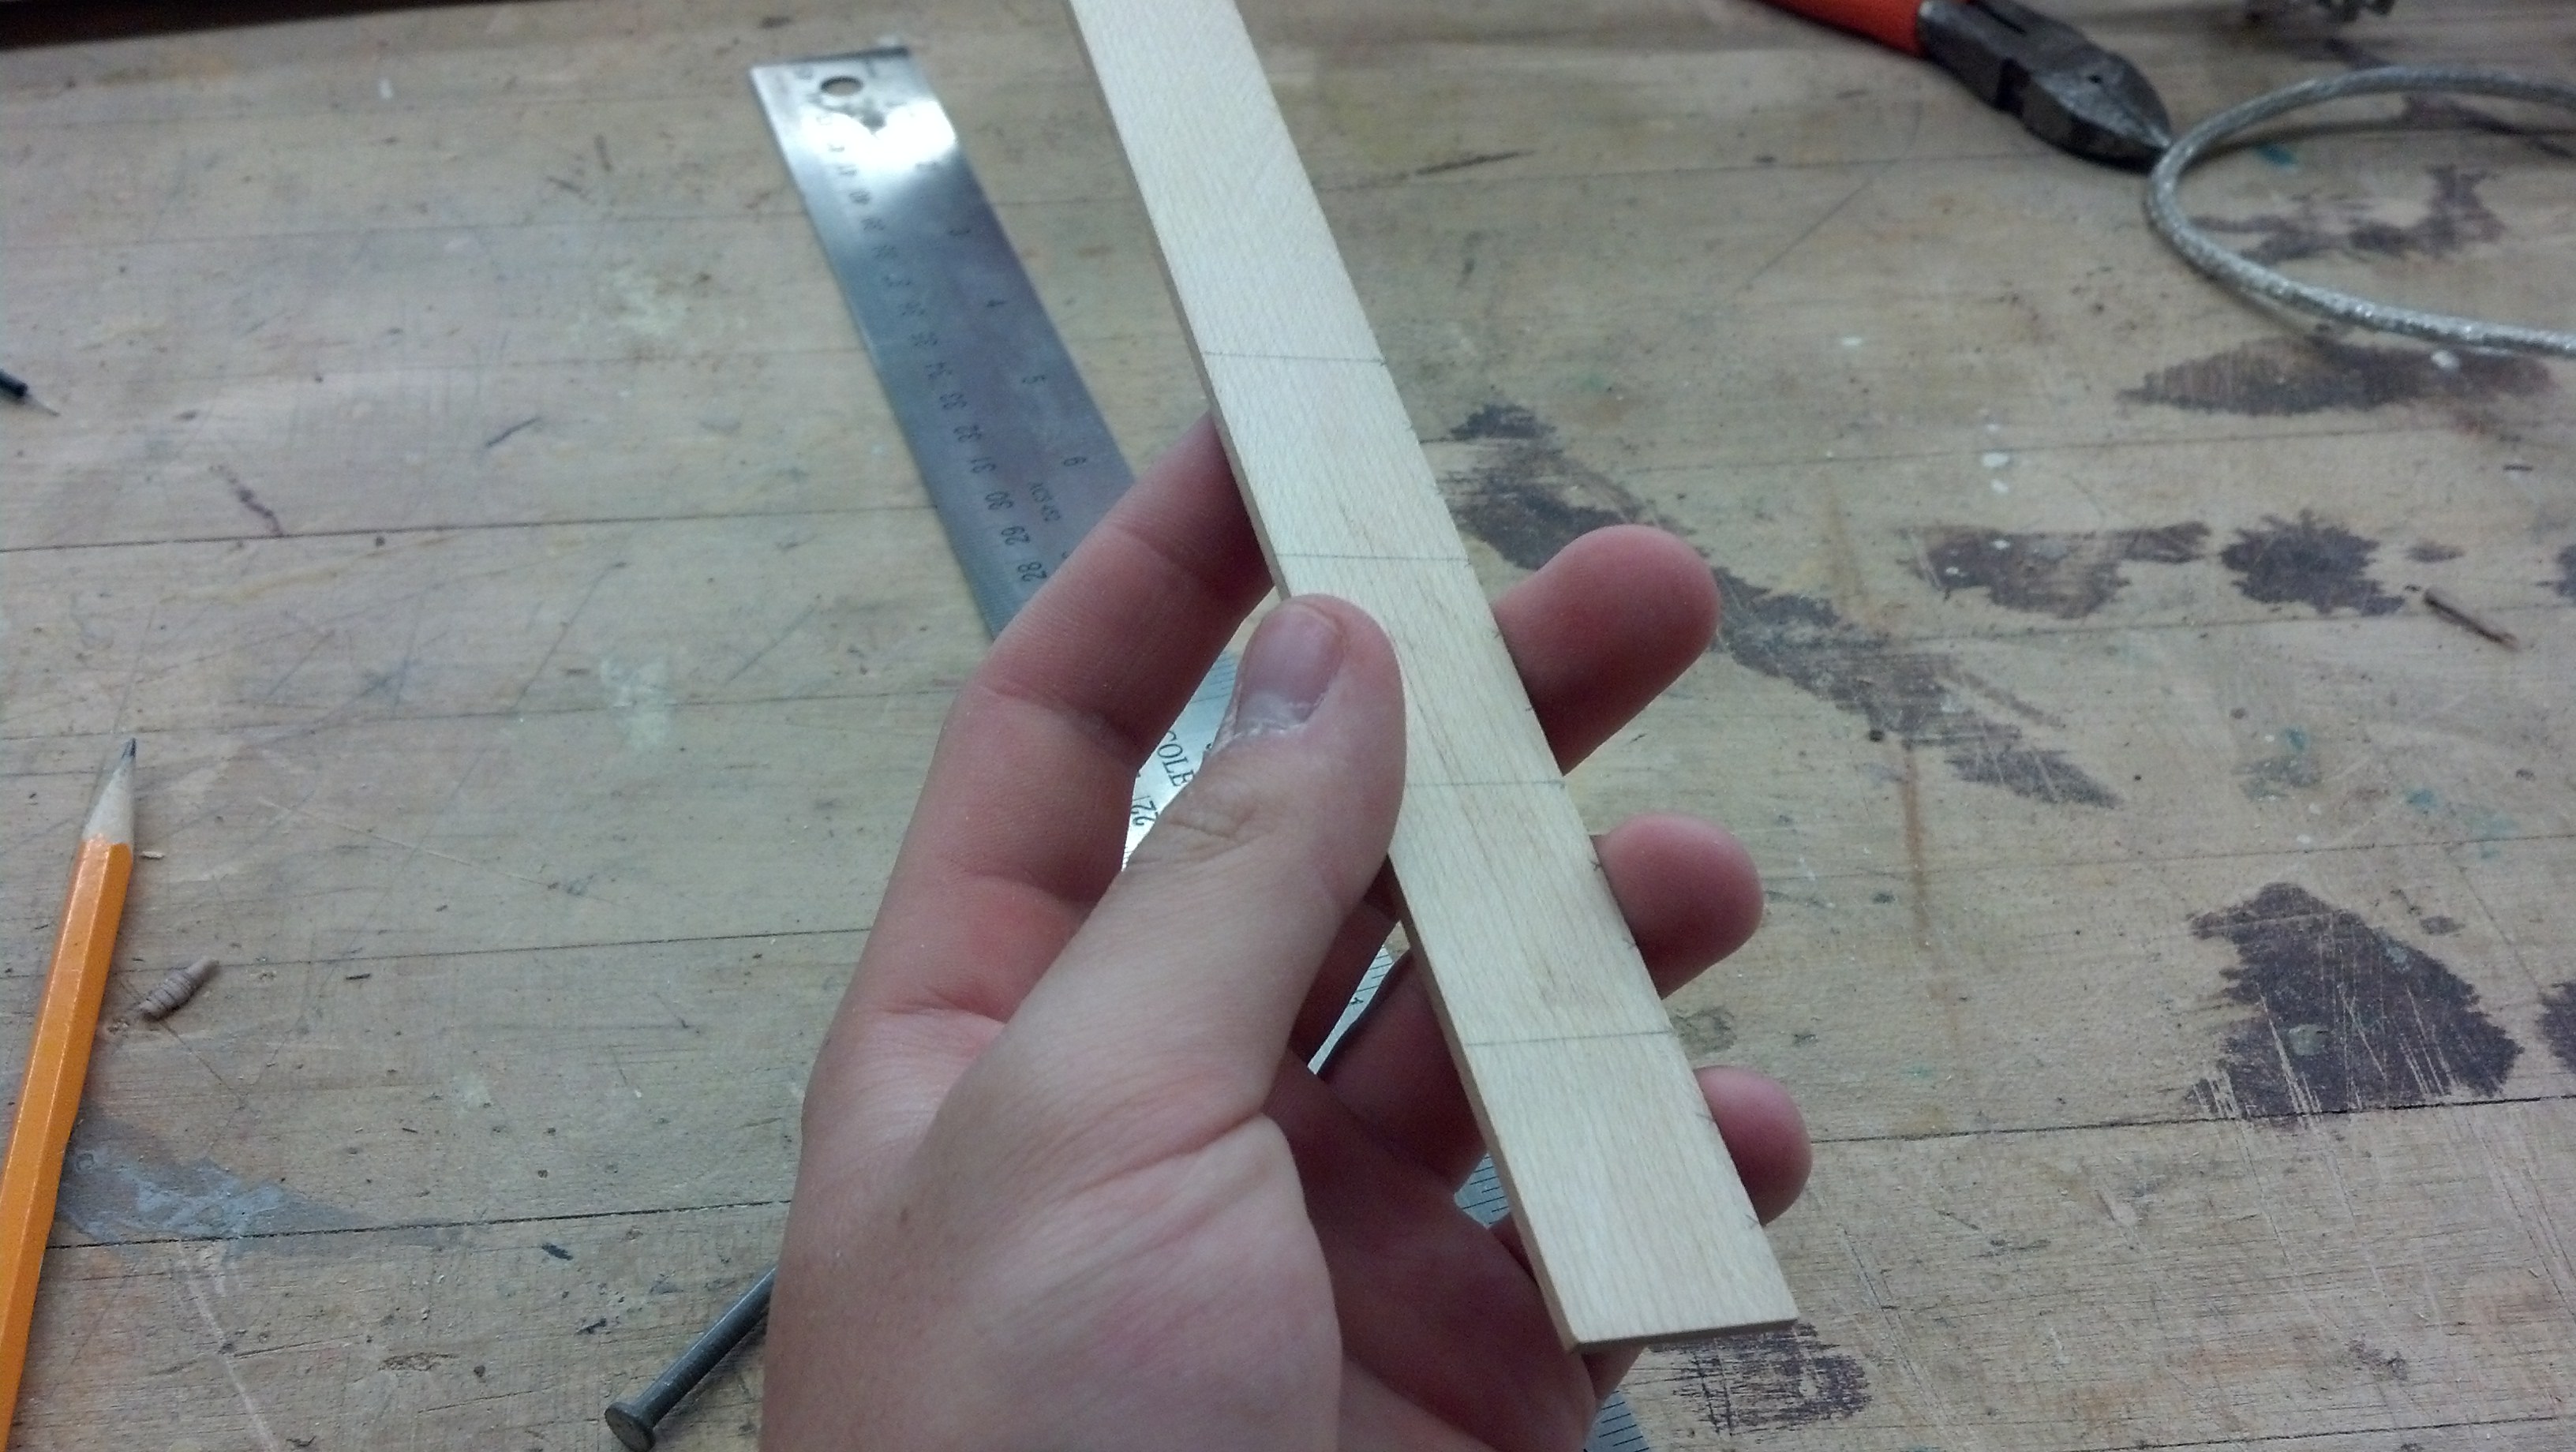
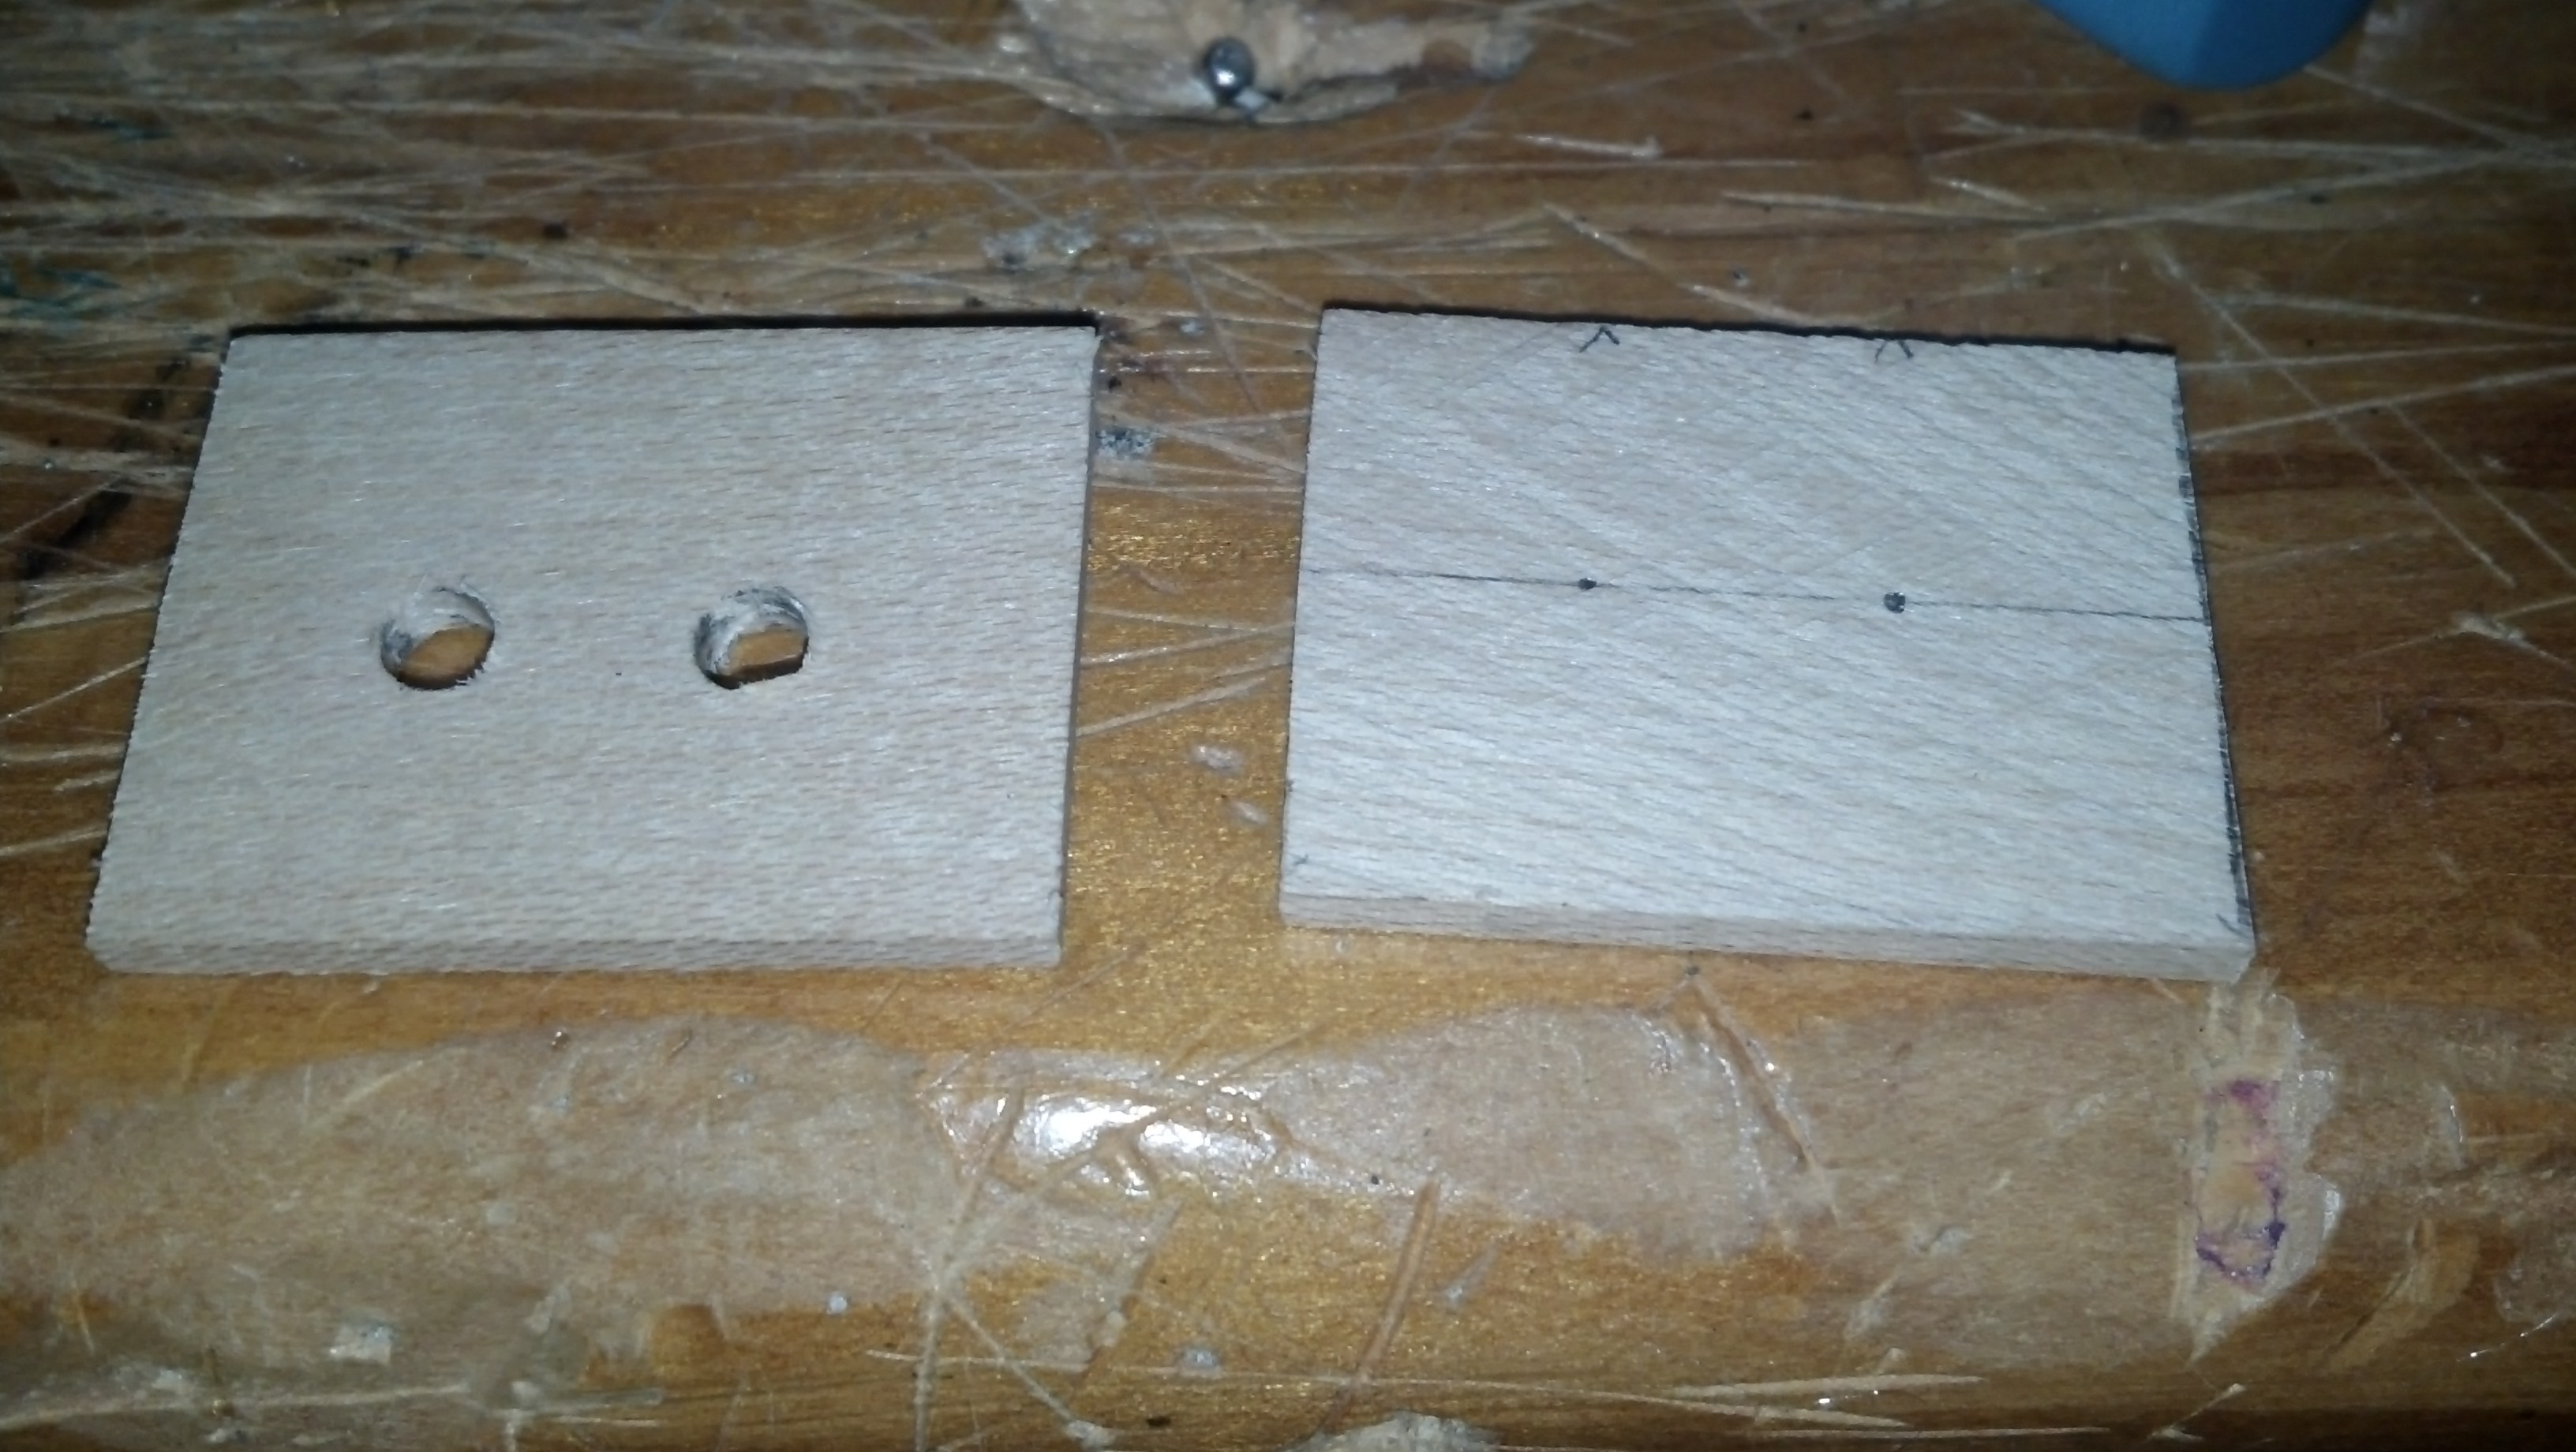
This project uses a TMP35-37 sensor to get a pretty precise temperature reading of the room. Later down in this post you can find out the algorithm to determine the temperature in Fahrenheit. It also uses a basic LDR to get the relative ambient light level in the room. Along with those two sensors, there are 4 relative humidity sensors of my own design, here’s a picture of them as seen in this post:
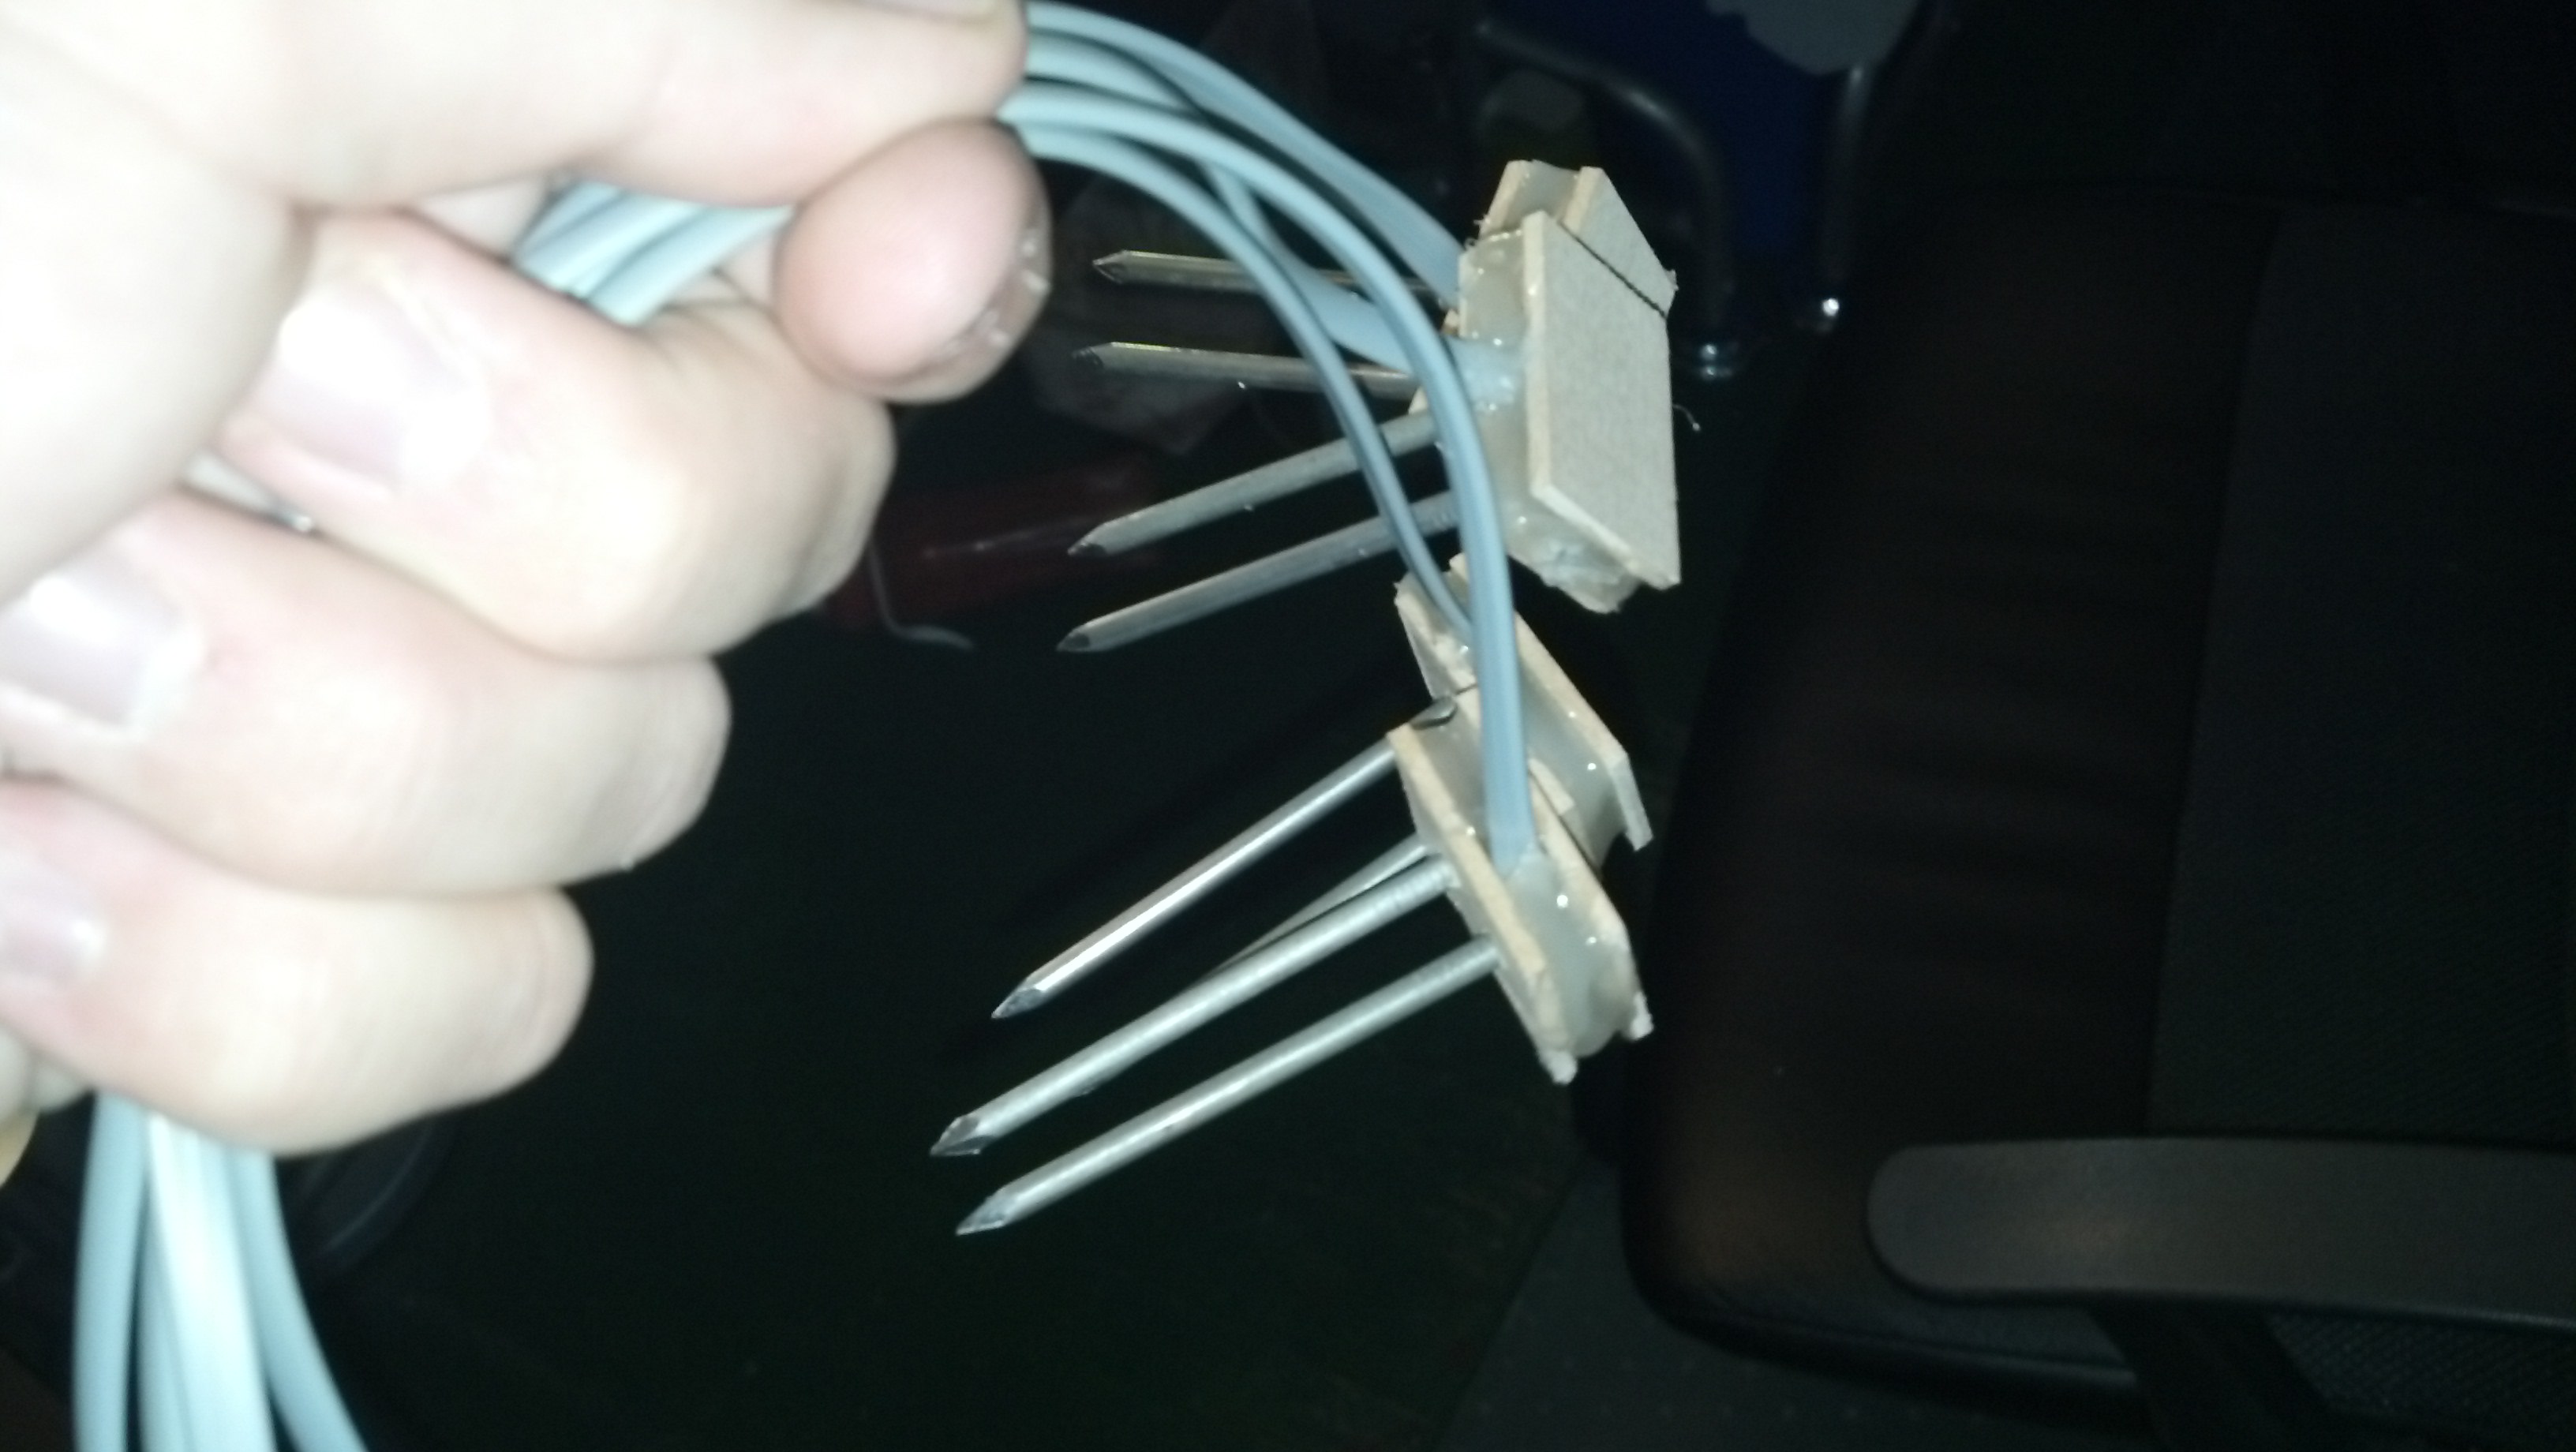
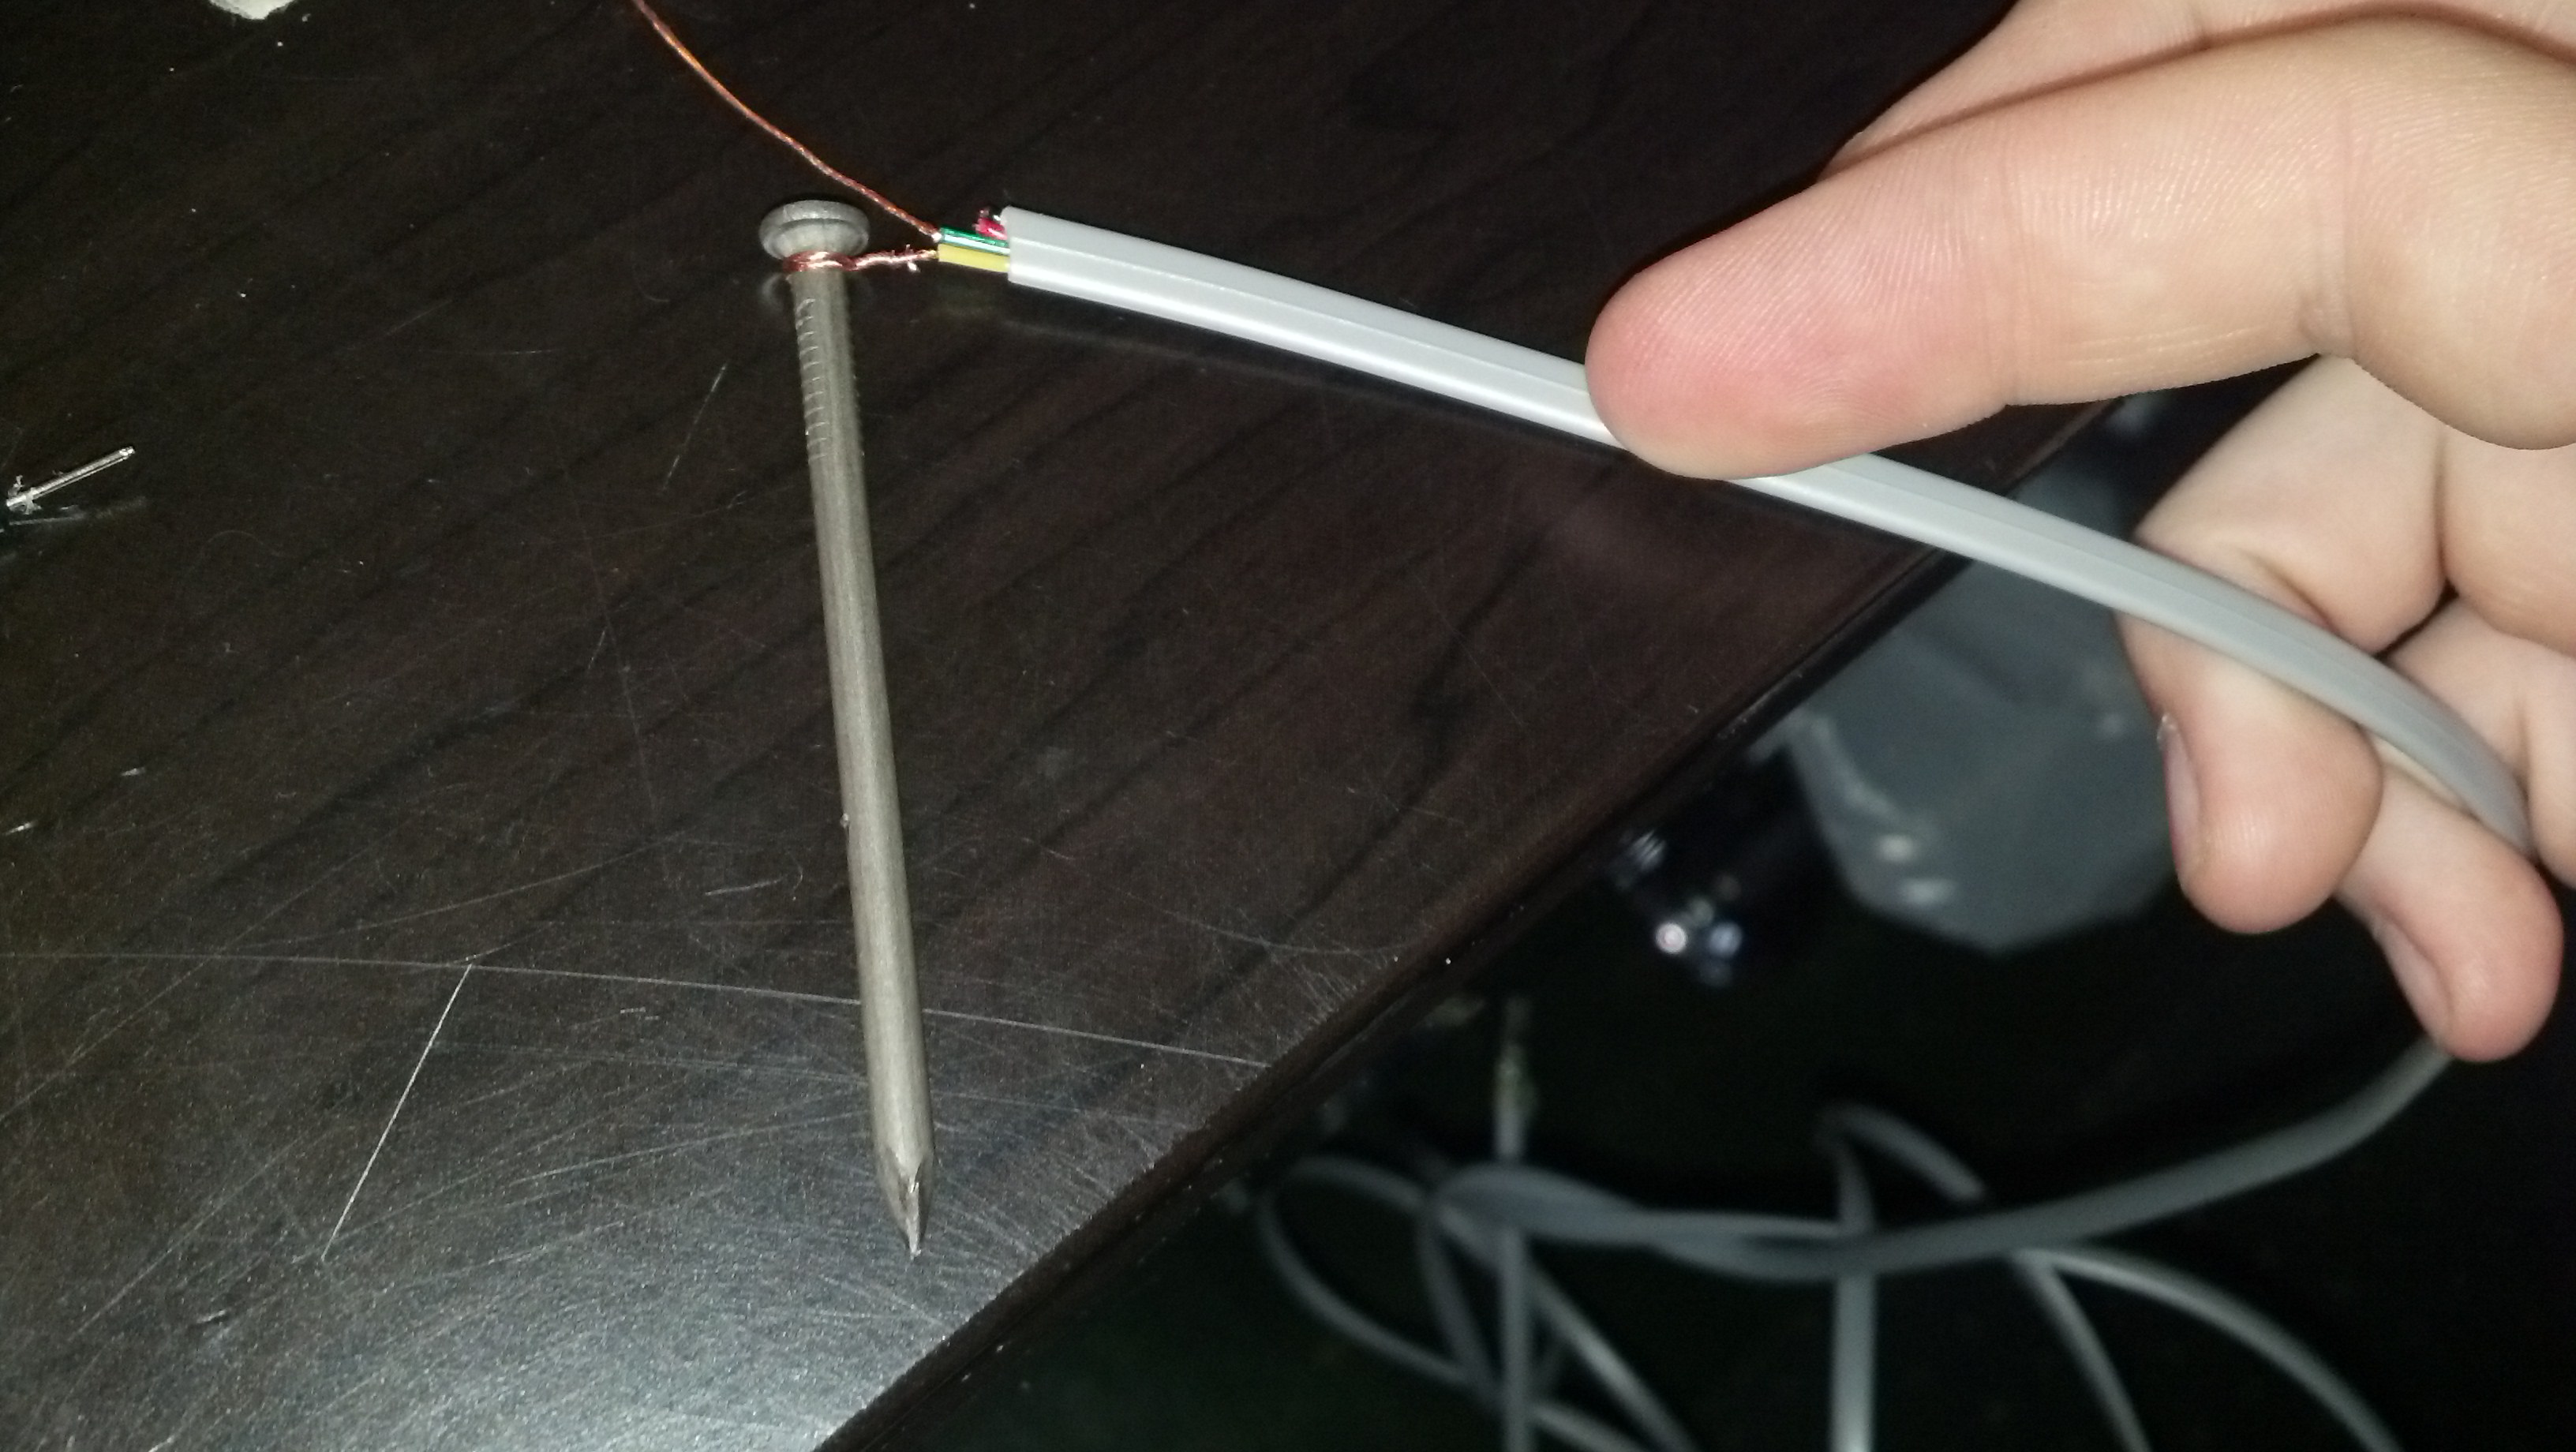
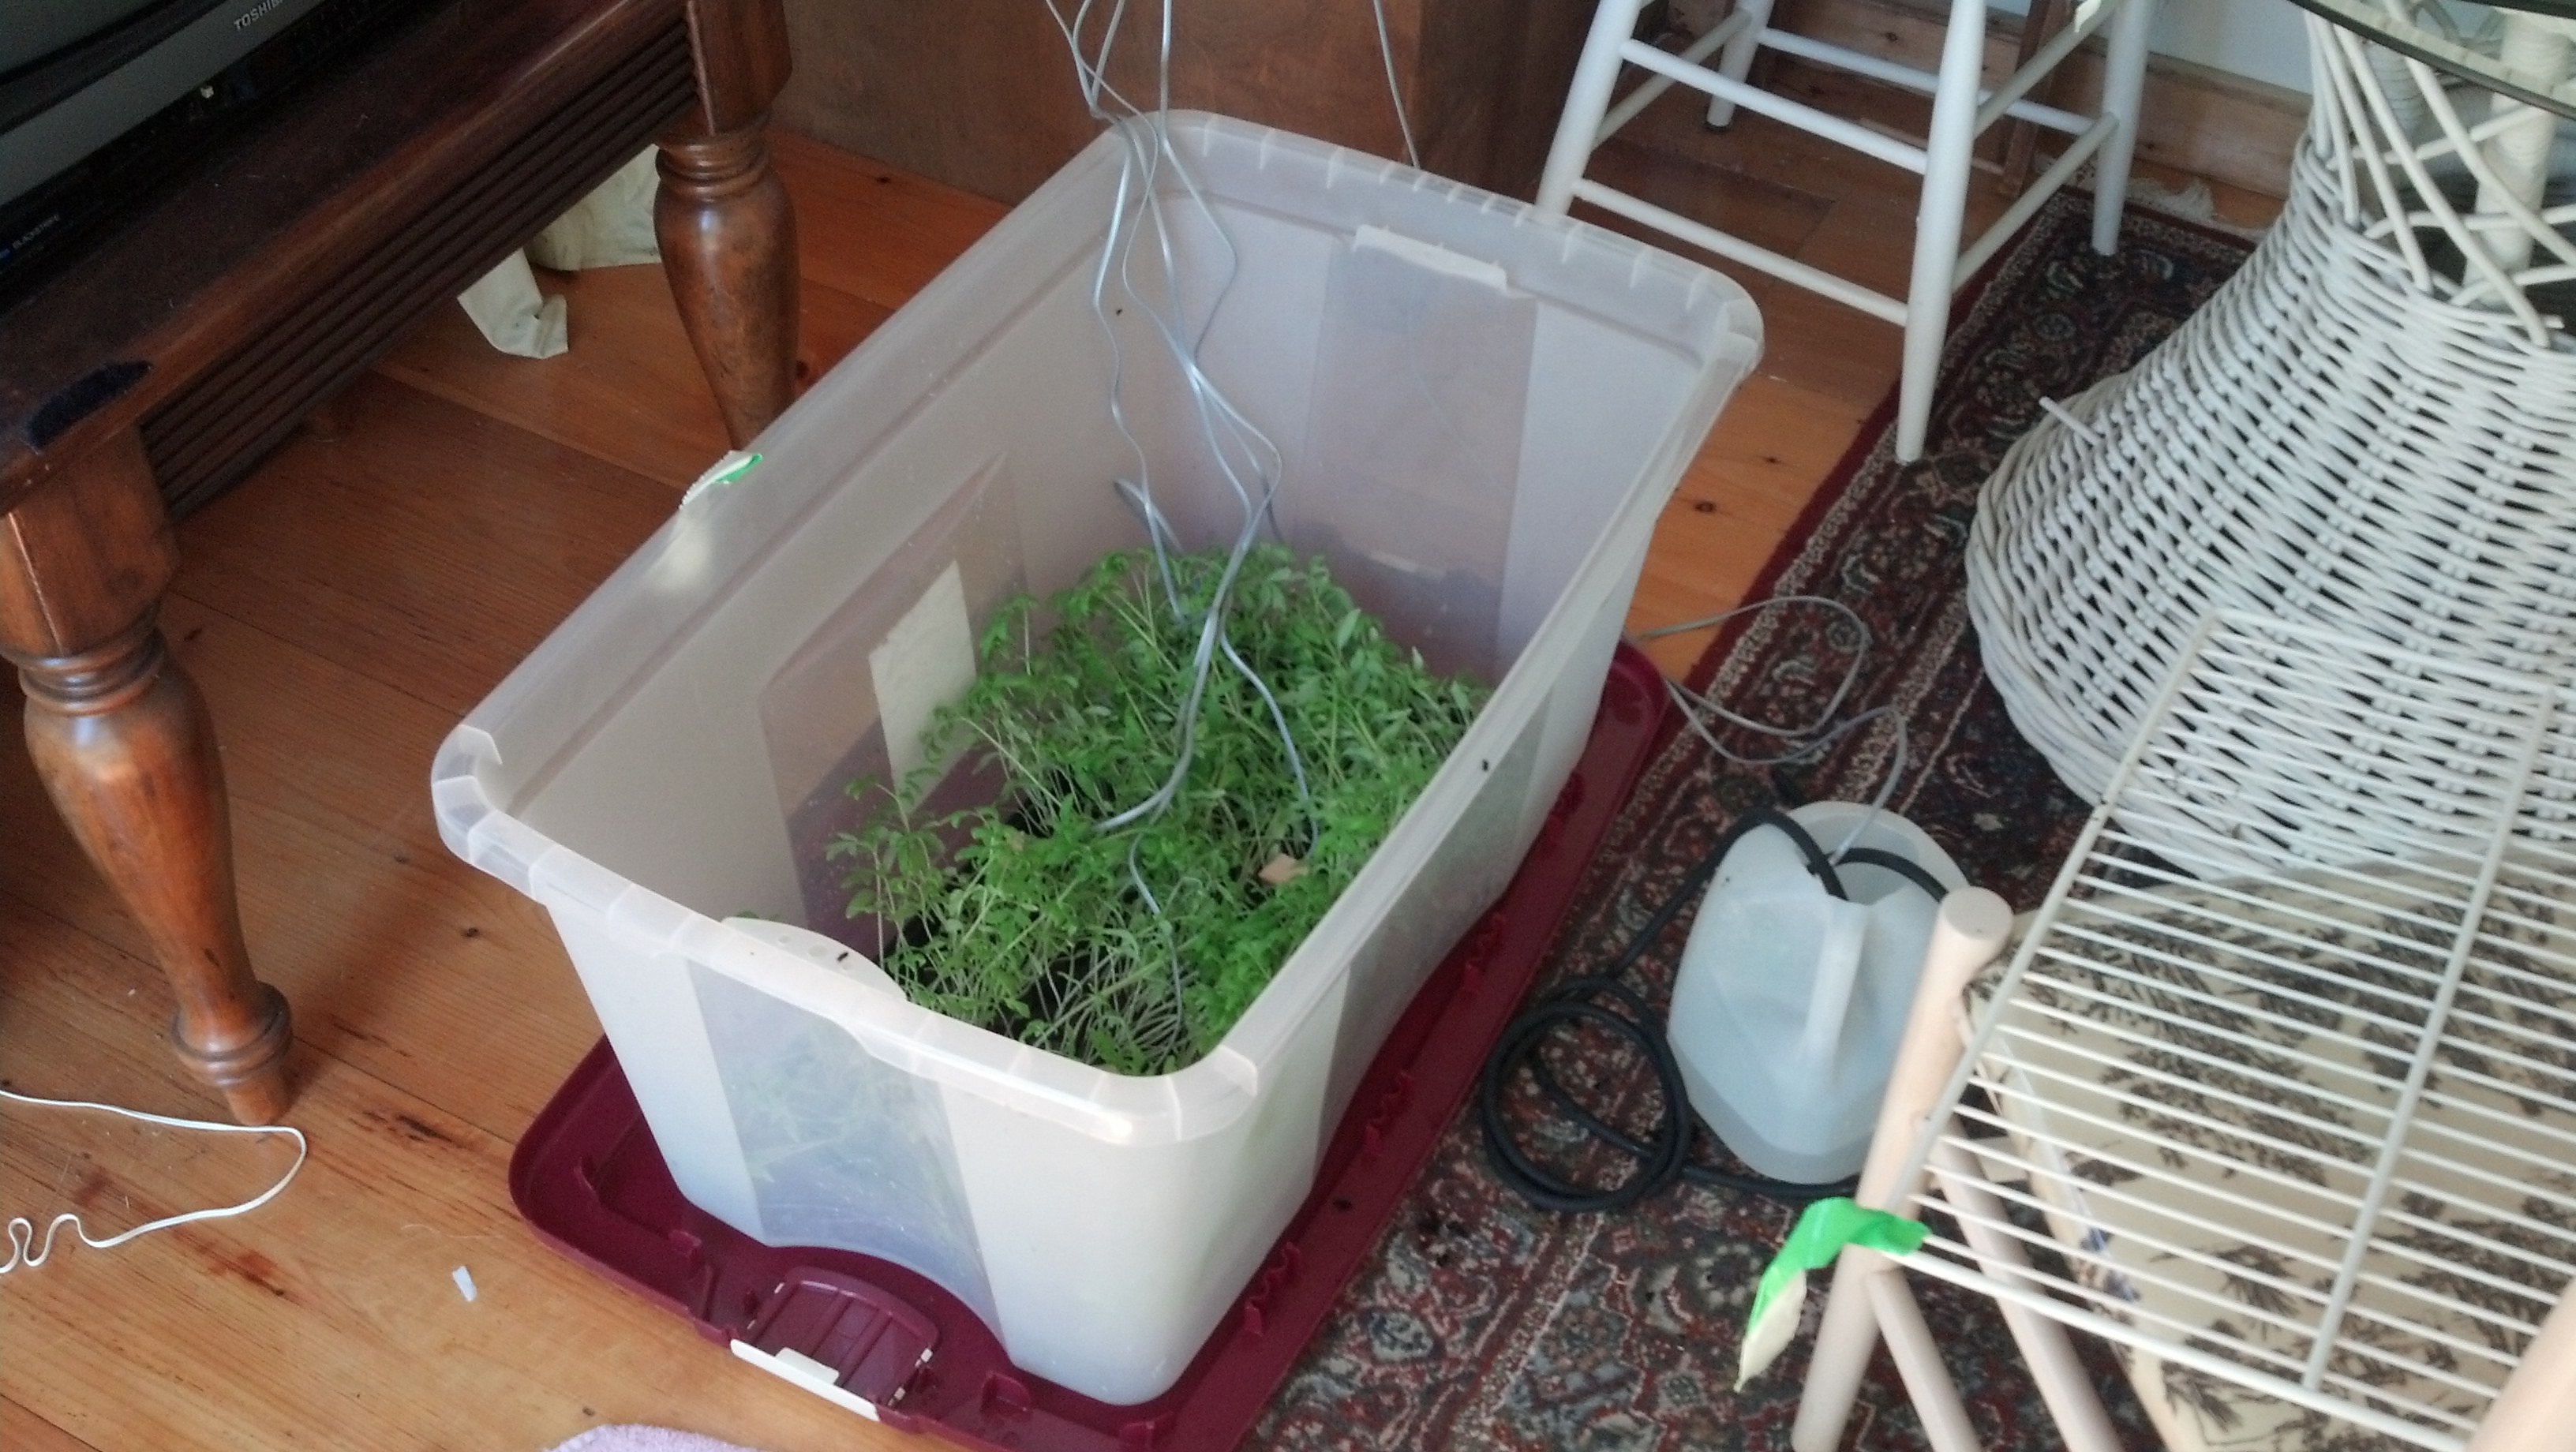
They’re hooked up to the ADC (mentioned later) in the same way that the LDR is, with a voltage dividing resistor, and then fed directly into ADC. The principal behind this sensor is that when you insert it into soil, the water in that soil connected the two probes, causing a voltage to flow across them. So if there is more water in the soil, more electrons will flow across them, and the analog value will be higher. It’s very basic, but it works. I’ve done several long term tests, and over time, as the soil becomes dryer, the value gets lower, indicating relative dryness. Here is a picture of the four probes in the soil, with the plants.
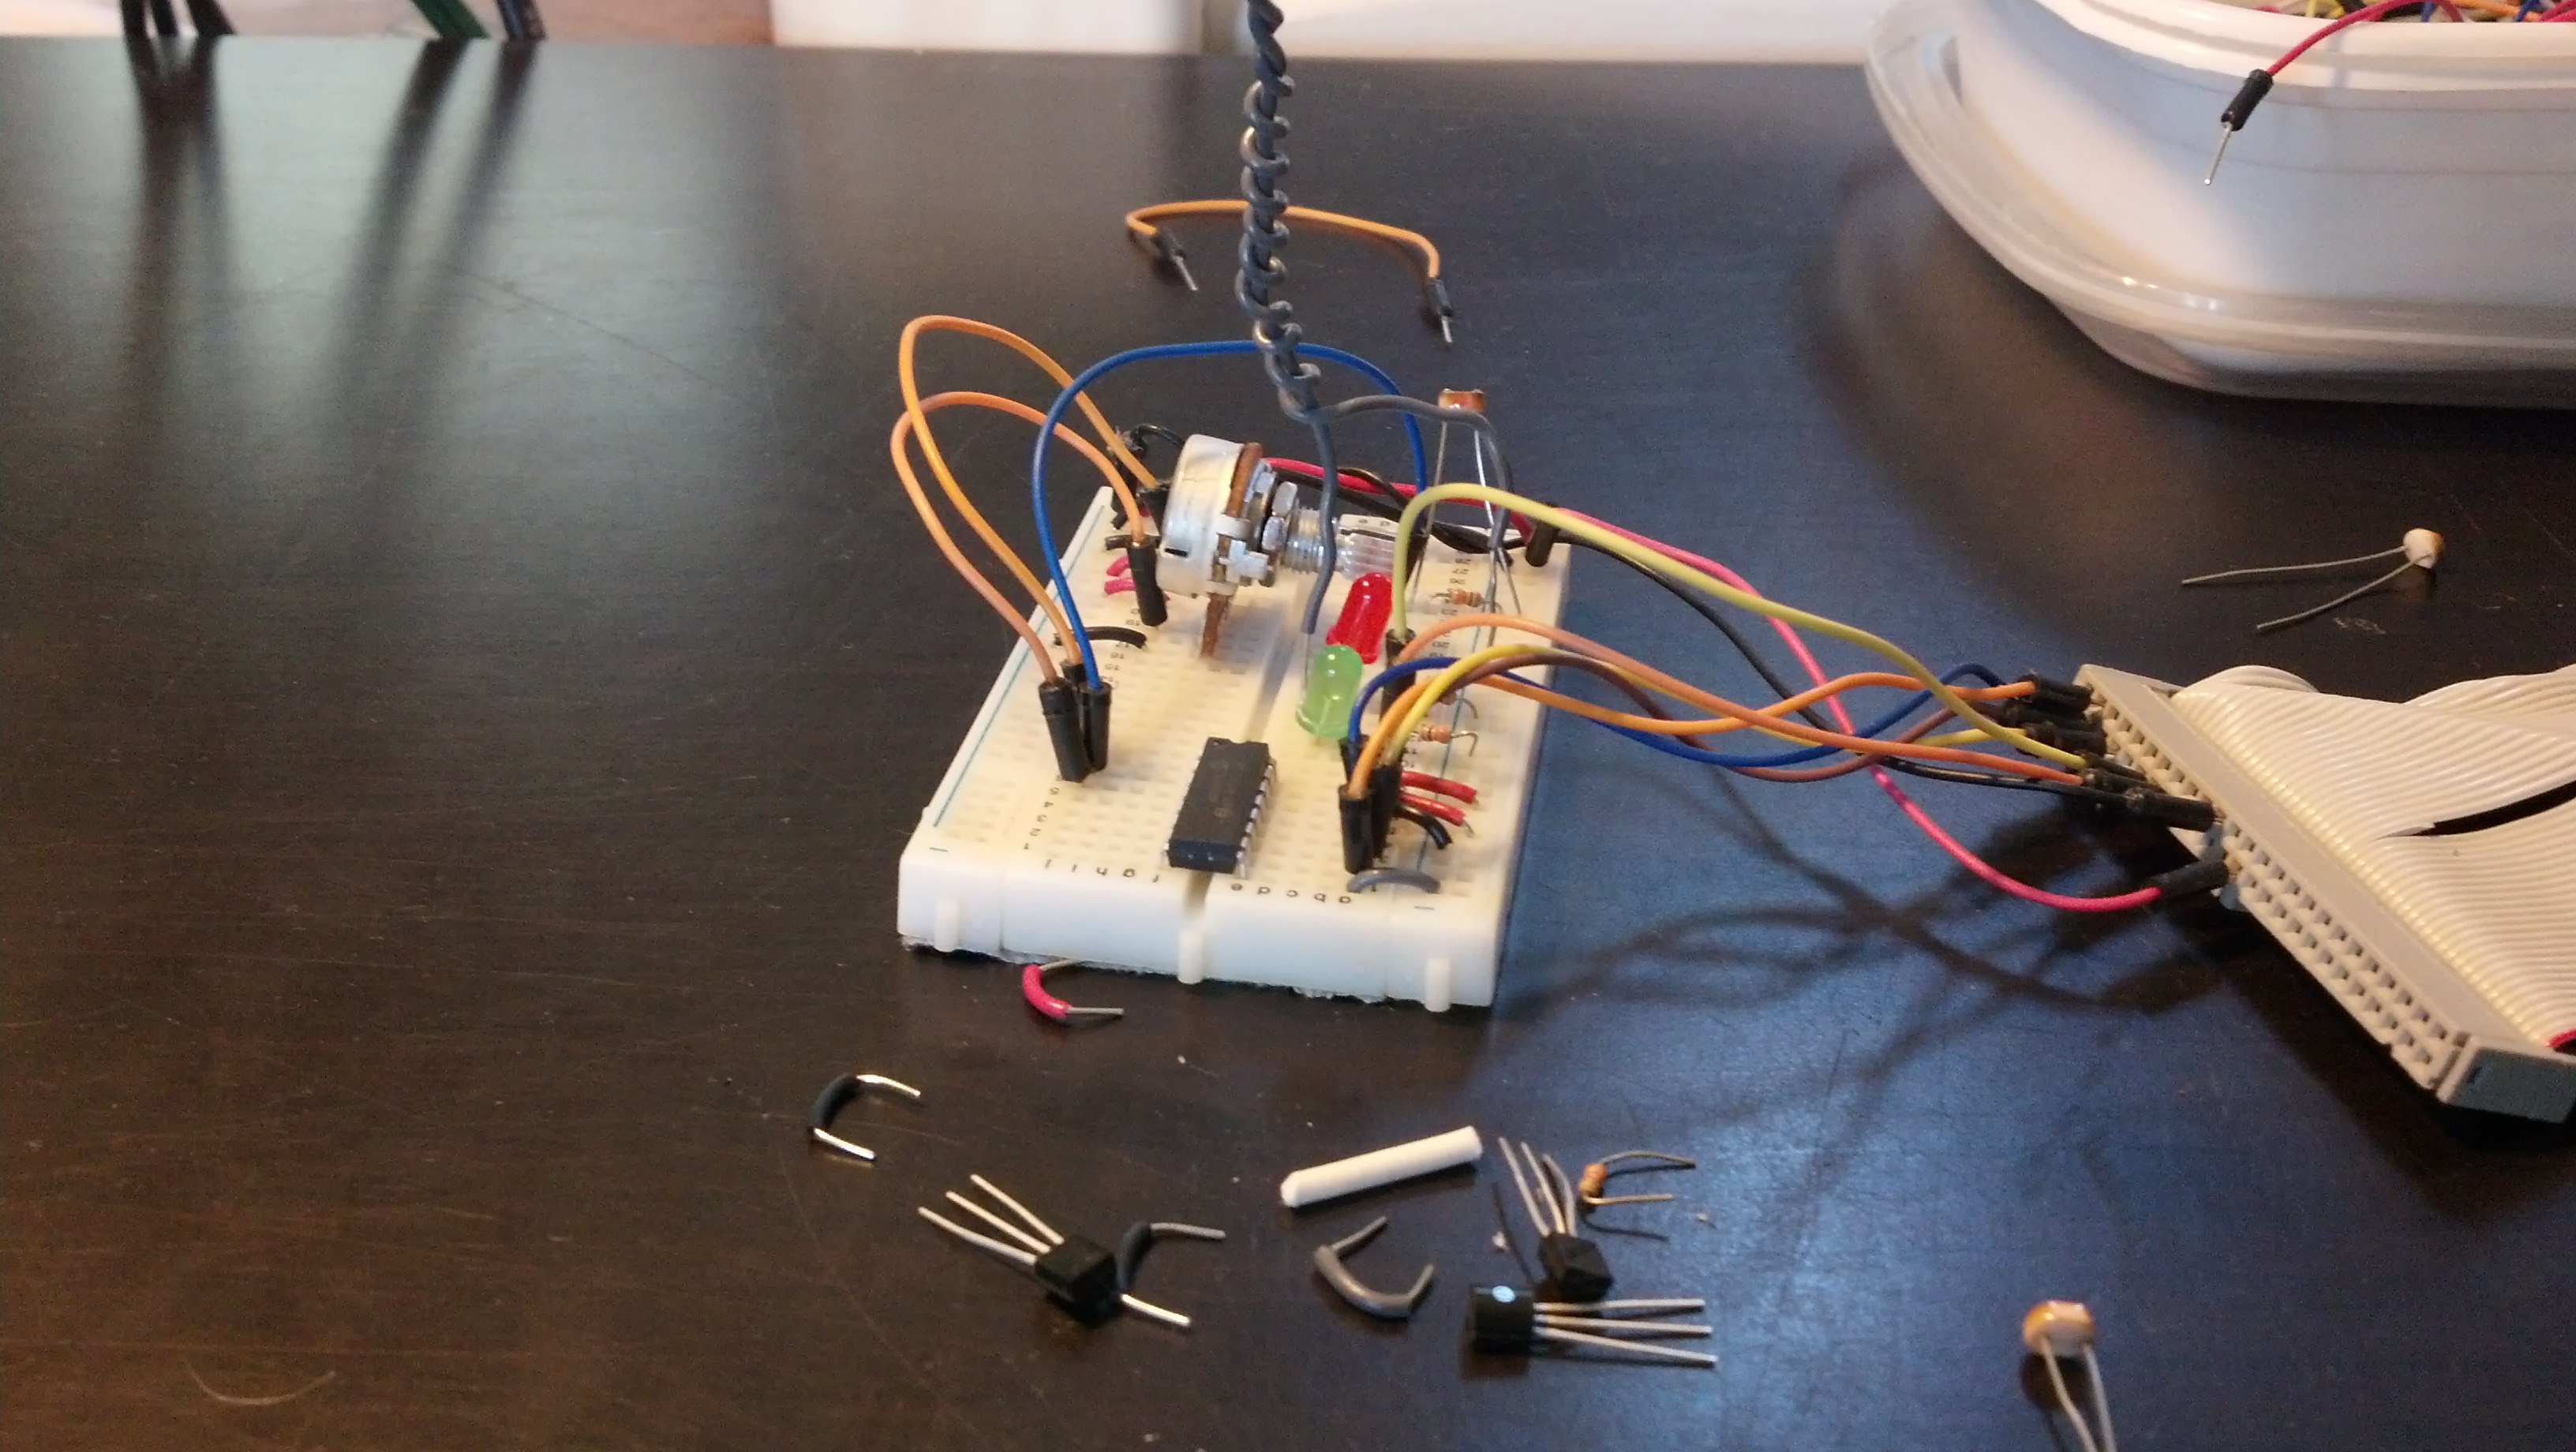
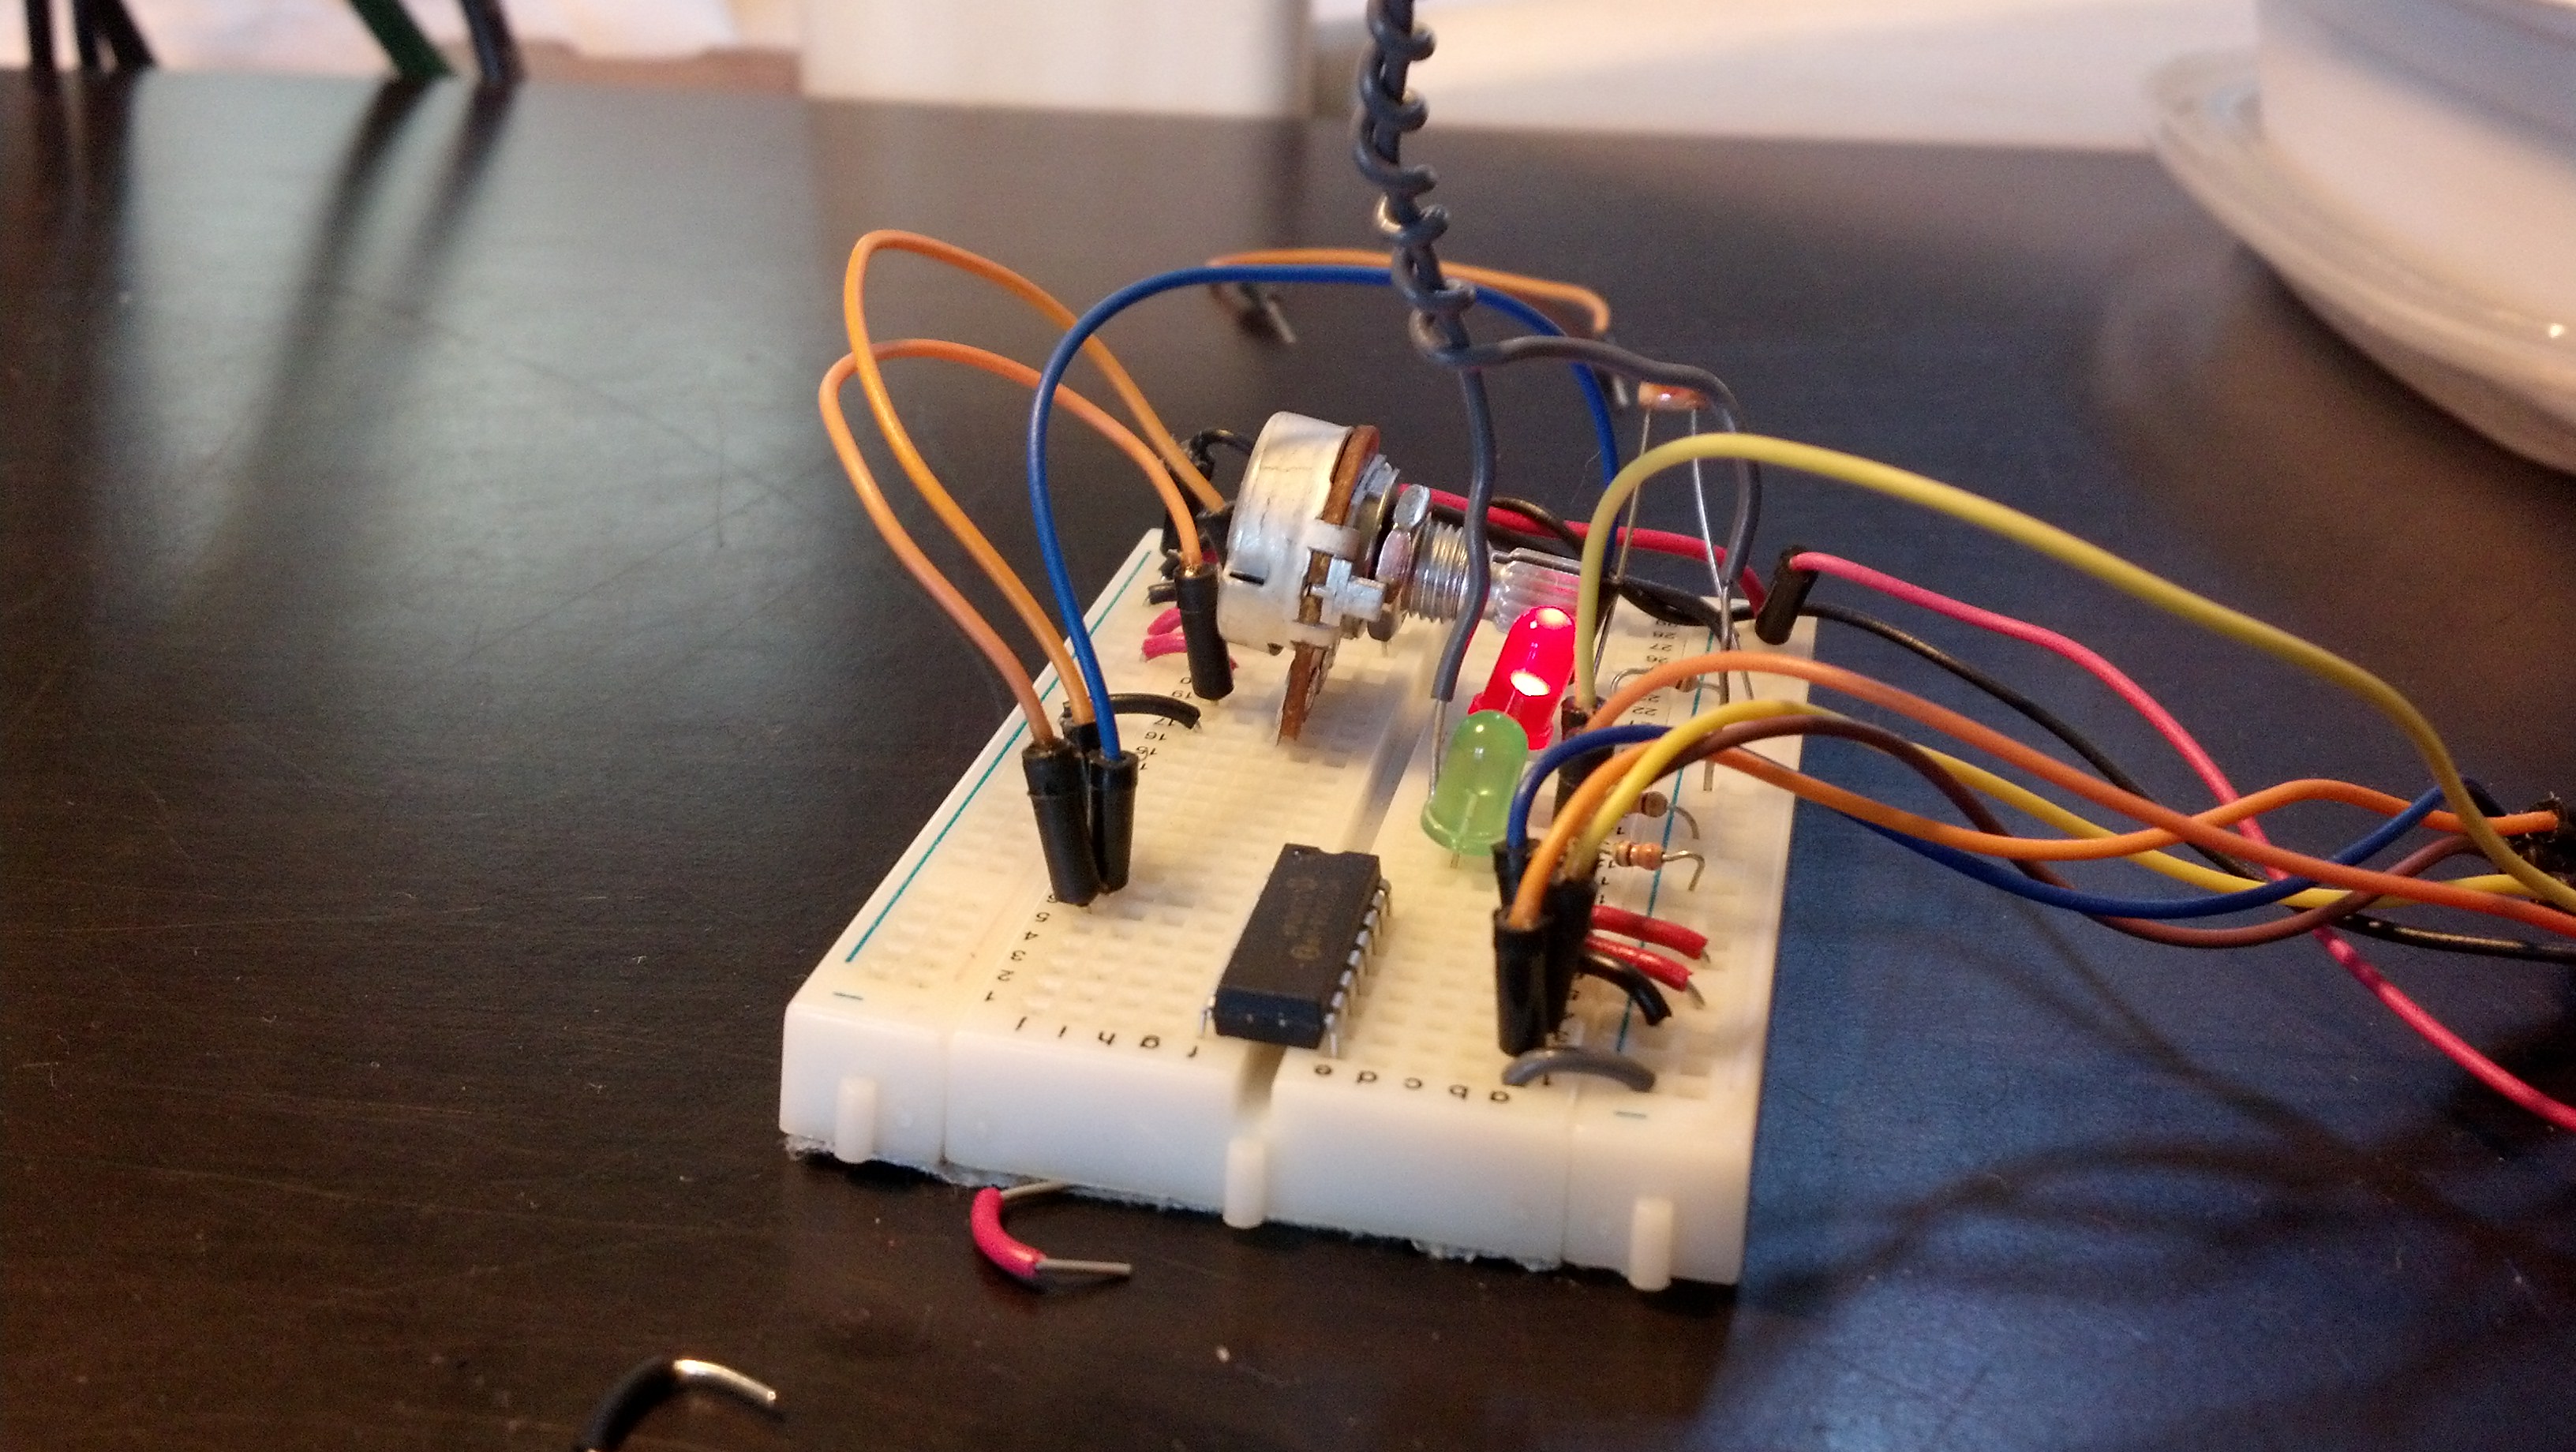
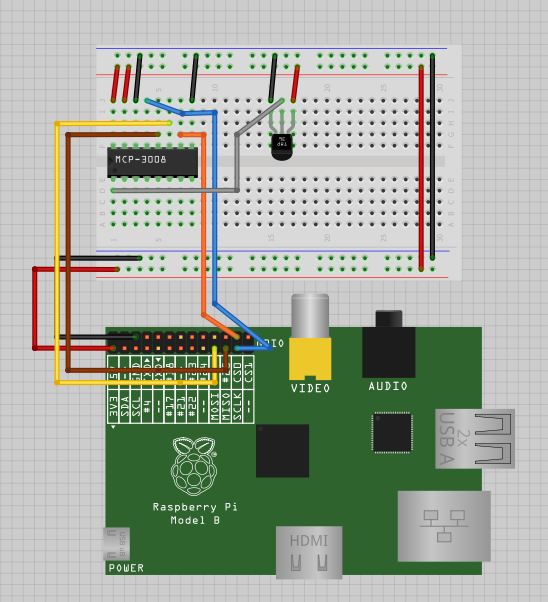
The TMP sensor’s output is plugged directly into the ADC and the LDR is very basically connected to the ADC as well, this is essentially how how the whole thing is setup on the breadboard:
Pump System
The pump system is pretty dead simple. Essentially it is a PowerSwitch Tail II switching the mains to a 9v DC power supply. The 9v power supply is connected directly to a 12v DC submersible pump. Instead of using a motor driver chip, which requires 3 pins to do, and the chip would get hot and whatnot, I’ve decided to go with this method.
The pump is not self priming. This means it cannot make the transition from pumping air to pumping water. I wrestled with this problem for a long time, and came up with what I think is an elegant solution. I submerged the pump directly into the water, which means the pump will never fill with air, and will always pump water when activated. Here’s a video explaining the pump system:
Raspberry Pi ADC
The next system is the ADC connected to the Raspberry Pi. It is an 8 bit, 8 port analog to digital converter that can easily run on 3.3v so it’s perfect for the pi. Here is the chip, and you set it up as follows (I took this from an earlier post I wrote)
Now we need to set up the specific libraries for python the first of which being spidev, the spi tool for the raspberry pi which we can grab from git using the following commands:
sudo apt-get install git
git clone git://github.com/doceme/py-spidev
cd py-spidev/
sudo apt-get install python-dev
sudo python setup.py install
You also need to (copied from http://scruss.com/blog/2013/01/19/the-quite-rubbish-clock/):
As root, edit the kernel module blacklist file:
sudo vi /etc/modprobe.d/raspi-blacklist.conf
Comment out the spi-bcm2708 line so it looks like this:
#blacklist spi-bcm2708
Save the file so that the module will load on future reboots. To enable the module now, enter:
sudo modprobe spi-bcm2708
To read from the ADC, add the following to your python code. The full code will be listed later:
#fuction that can read the adc
def readadc(adcnum):
# read SPI data from MCP3008 chip, 8 possible adc's (0 thru 7)
    if adcnum > 7 or adcnum < 0:
        return -1
    r = spi.xfer2([1, 8 + adcnum << 4, 0])
    adcout = ((r[1] & 3) << 8) + r[2]
    return adcout
So just use “readadc(n)” to get a value.
Python Code
I’ve made a real effort this time to comment my code well, so I’m not going to do a line by line breakdown like I often do, but I will clearly state the installs and setup things as follows. I’m assuming you have python-dev installed.
Download and install: APScheduler, this is a very straight forward install
Download and install: tweepy, you will need to go through the API setup process.
Download and install: flickrapi, you will need to go through the API setup process.
Here’s the source code for the python component of this project:
#Timing setup
from datetime import datetime
from apscheduler.scheduler import Scheduler
import time
import datetime
import sys
import os
now =datetime.datetime.now()
#import logging #if you start getting logging errors, uncomment these two lines
#logging.basicConfig()
#GPIO setup
import RPi.GPIO as GPIO
GPIO.setmode(GPIO.BOARD)
GPIO.cleanup()
pin = 26 #pin for the adc
GPIO.setup(pin, GPIO.OUT)
NPNtrans = 3 #the pin for the npn transistor
GPIO.setup(NPNtrans, GPIO.OUT)
sampleLED = 5 #the indicator LED
GPIO.setup(sampleLED, GPIO.OUT)
pump = 7 #pin for the pump
GPIO.setup(pump, GPIO.OUT)
#the adc's SPI setup
import spidev
spi = spidev.SpiDev()
spi.open(0, 0)
#sets up the program's ability to write to a mysql database
import MySQLdb
con = MySQLdb.connect('localhost','piplanter_user','piplanter_pass','piplanter');
cursor = con.cursor()
#tweepy setup, you must use the keys given to you when you create your app
import tweepy
consumer_key=""
consumer_secret=""
access_token=""
access_token_secret=""
#"logs in" to twitter,
auth = tweepy.OAuthHandler(consumer_key, consumer_secret)
auth.set_access_token(access_token, access_token_secret)
api = tweepy.API(auth)
#Flickr Setup
import flickrapi
api_key = ''
api_secret = ''
flickr = flickrapi.FlickrAPI(api_key, api_secret, format='json')
(token, frob) = flickr.get_token_part_one(perms='write')
if not token: raw_input("Press ENTER after you authorized this program")
flickr.get_token_part_two((token, frob))
#Variable Setup
ontime = 20
#fuction that can read the adc
def readadc(adcnum):
# read SPI data from MCP3008 chip, 8 possible adc's (0 thru 7)
if adcnum > 7 or adcnum < 0:
return -1
r = spi.xfer2([1, 8 + adcnum << 4, 0])
adcout = ((r[1] & 3) << 8) + r[2]
return adcout
def slowSample():
date0 = "21-06-2013 15"
date1 = "25-06-2013 12"
date2 = "29-06-2013 12"
date3 = "04-07-2013 12"
date4 = "06-07-2013 12"
if str(time.strftime('%d-%m-%Y %H')) == date0:
water()
if str(time.strftime('%d-%m-%Y %H')) == date1:
water()
if str(time.strftime('%d-%m-%Y %H')) == date2:
water()
if str(time.strftime('%d-%m-%Y %H')) == date3:
water()
if str(time.strftime('%d-%m-%Y %H')) == date4:
water()
print "----------start----------"
GPIO.output(NPNtrans, True)
GPIO.output(sampleLED, True)
time.sleep(1)
sampleTime = time.ctime()
mst1 = readadc(0)
mst2 = readadc(1)
mst3 = readadc(2)
mst4 = readadc(3)
pot1 = readadc(4)
ldr1 = readadc(5)
millivolts = readadc(6)*(3300.0/1024.0)
temp_c = ((millivolts - 100.0)/10)-40.0
tmp1 = (temp_c * 9.0 / 5.0) + 32
#prints debug info to console
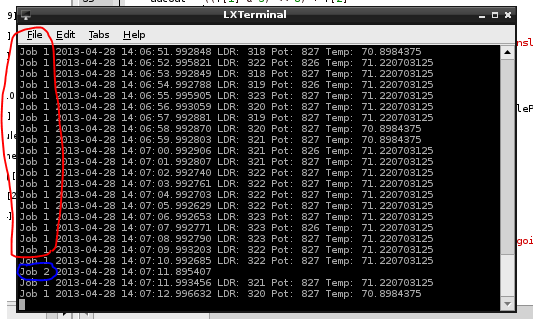
print sampleTime,"|","MST1:",mst1,"MST2:",mst2,"MST3:",mst3,"MST4:",mst4,"Pot1:",pot1,"LDR1:",ldr1,"TMP1:",tmp1 #prints the debug info
#adds the data to the mysql table
cursor.execute("INSERT INTO piplanter_table_17(Time,mst1_V,mst2_V,mst3_V,mst4_V,pot1_V,ldr1_V,tmp1_F) VALUES(%s,%s,%s,%s,%s,%s,%s,%s)",(sampleTime,mst1,mst2,mst3,mst4,pot1,ldr1,tmp1))
con.commit() #this is important for live updating
GPIO.output(NPNtrans, False) #turns the probes off
#renders the image of the graph
print "render start"
os.system("php /opt/bitnami/wordpress/piplanter/renderScript.php") #renders the .png file
print "render complete"
#finds the newest image in the directory
allfiles = sorted(os.listdir('/opt/bitnami/wordpress/piplanter/renders/'), key=lambda p: os.path.getctime(os.path.join('/opt/bitnami/wordpress/piplanter/renders/', p)))
newest = '/opt/bitnami/wordpress/piplanter/renders/'+allfiles[-1]
print 'File for upload: ' + newest #prints location and file to console
response = flickr.upload(filename=newest, title=sampleTime, format='etree') #uploads the file to flickr
photoID = response.find('photoid').text #gets the id of the photo for constructing a url
print 'Upload Successful, Photo ID: ' + photoID #more debug info
#tweets the image and data
send = 'Brghtnss: ' + str(format((((float(ldr1)/1024)*100)),'.0f')) + '% / ' + 'Tmprtr: ' + str(format(tmp1,'.0f')) + ' Dg F' + ' / Avg Plnt Moisture: '+ str(format(float((float((mst1+mst2+mst3+mst4)/4)/1024)*100),'.0f')) + '%' + ' Graph: ' +'http://www.flickr.com/photos/97350286@N08/'+photoID +' - www.esologic.com/?p=643' #builds the text of the tweet
print "Tweeting:" , send #for debug purposes
api.update_status(send) #tweets the tweet
time.sleep(.1)
GPIO.output(sampleLED, False)
print "-----------end-----------"
def water():
print "===== Starting Watering Process ====="
GPIO.output(NPNtrans, True)
GPIO.output(sampleLED, True)
time.sleep(1)
sensor1_before = readadc(0)
sensor2_before = readadc(1)
sensor3_before = readadc(2)
sensor4_before = readadc(3)
before = "WATERING START / Moisture Before - " + "Sensor 1:" + str(sensor1_before) + " Sensor 2:" + str(sensor2_before) + " Sensor 3:" + str(sensor3_before) + " Sensor 4:" + str(sensor4_before) + " - Average:" + str((float(sensor1_before+sensor2_before+sensor3_before+sensor4_before)/4))
api.update_status(before)
print before
GPIO.output(pump, True)
time.sleep(ontime)
GPIO.output(pump, False)
time.sleep(60) #gives the water time to penetrate the soil
sensor1_after = readadc(0)
sensor2_after = readadc(1)
sensor3_after = readadc(2)
sensor4_after = readadc(3)
after = "WATERING COMPLETED / Moisture After - " + "Sensor 1:" + str(sensor1_after) + " Sensor 2:" + str(sensor2_after) + " Sensor 3:" + str(sensor3_after) + " Sensor 4:" + str(sensor4_after) + " - Average: " + str((float(sensor1_after+sensor2_after+sensor3_after+sensor4_after)/4))
api.update_status(after)
print after
GPIO.output(NPNtrans, False)
GPIO.output(sampleLED, False)
print "====== Watering Process Complete ====="
#water()
slowSample() #runs the sample once before the interval starts, mostly a debug function
scheduler = Scheduler(standalone=True)
scheduler.add_interval_job(slowSample, hours=1)
scheduler.start() #runs the program indefianately once every hour
There you go! Essentially, every hour, the raspberry pi samples data from 4 humidity probes, an LDR and a tmp sensor. Once the sampling is complete, it dumps the data into a mysql database. From there the data is rendered into a graph using pChart in the form of a .png image. From there, that .png files is uploaded to flickr using this api. Once the file is uploaded, it returns it’s photo ID to the python script. From there, a tweet is built containing the brightness at the time of the tweet, the temperature at the time of the tweet, and the average moisture of the plants. It also uses the photo ID from flickr obtained earlier to build a URL leading to that image on flickr which it tweets as well. The final part of the tweet is a url that leads to this post! (taken from)
MySQL Database
The database is extremely simple, after installing MySQL set it up and create table that follows this syntax:
CREATE TABLE piplanter_table_17(Sample_Number INT NOT NULL AUTO_INCREMENT PRIMARY KEY, Time VARCHAR(100), mst1_V VARCHAR(100), mst2_V VARCHAR(100), mst3_V VARCHAR(100), mst4_V VARCHAR(100), pot1_V VARCHAR(100), ldr1_V VARCHAR(100), tmp1_F VARCHAR(100) );
Pretty basic stuff, the table is just where the python script dumps the data every hour.
PChart Graph
The software driving the graphing part of the project is a bit of php graphing software called pchart. It allows me to graph mysql values from a table in a variety of ways. It is very important, and the code for the php script is as follows:
<?php

/* Include all the classes */
include("/srv/www/lib/pChart/class/pData.class.php");
include("/srv/www/lib/pChart/class/pDraw.class.php");
include("/srv/www/lib/pChart/class/pImage.class.php");

$myData = new pData(); /* Create your dataset object */

$db = mysql_connect("localhost", "user", "pass"); //location of server, db username, db pass
mysql_select_db("piplanter", $db);

$Requete = "SELECT * FROM `piplanter_table_17`"; //table name
$Result = mysql_query($Requete, $db);

/*This fetches the data from the mysql database, and adds it to pchart as points*/
while($row = mysql_fetch_array($Result))
{
	$Time = $row["Time"];
	$myData->addPoints($Time,"Time");

	$mst1_V = $row["mst1_V"];
	$myData->addPoints($mst1_V,"mst1_V");
	$mst2_V = $row["mst2_V"];
	$myData->addPoints($mst2_V,"mst2_V");
	$mst3_V = $row["mst3_V"];
	$myData->addPoints($mst3_V,"mst3_V");
	$mst4_V = $row["mst4_V"];
	$myData->addPoints($mst4_V,"mst4_V");

	$ldr1_V = $row["ldr1_V"];
	$myData->addPoints($ldr1_V,"ldr1_V");

	$tmp1_F = $row["tmp1_F"];
	$myData->addPoints($tmp1_F,"tmp1_F");
}

$myData-> setSerieOnAxis("tmp1_F", 0); //assigns the data to the frist axis
$myData-> setAxisName(0, "Degrees F"); //adds the label to the first axis

$myData-> setSerieOnAxis("ldr1_V", 1);
$myData-> setAxisName(1, "LDR");

$myData-> setSerieOnAxis("mst1_V", 2);
$myData-> setSerieWeight("mst1_V",2);
$myData-> setSerieOnAxis("mst2_V", 2);
$myData-> setSerieOnAxis("mst3_V", 2);
$myData-> setSerieOnAxis("mst4_V", 2);
$myData-> setAxisName(2, "Relative Moisture");

$myData->setAbscissa("Time"); //sets the time data set as the x axis label

$myData-> setSerieWeight("mst1_V",1); //draws the line tickness
$myData->setPalette("mst1_V",array("R"=>58,"G"=>95,"B"=>205,"Alpha"=>80)); //sets the line color
$myData-> setSerieWeight("mst2_V",1);
$myData->setPalette("mst2_V",array("R"=>39,"G"=>64,"B"=>139,"Alpha"=>80));
$myData-> setSerieWeight("mst3_V",1);
$myData->setPalette("mst3_V",array("R"=>0,"G"=>34,"B"=>102,"Alpha"=>80));
$myData-> setSerieWeight("mst4_V",1);
$myData->setPalette("mst4_V",array("R"=>67,"G"=>110,"B"=>238,"Alpha"=>80));

$myData-> setSerieWeight("ldr1_V",2);
$myData-> setSerieTicks("ldr1_V", 4);

$myData-> setSerieWeight("tmp1_F",2);
$myData-> setSerieTicks("tmp1_F", 4);

$myPicture = new pImage(2000,500,$myData); /* Create a pChart object and associate your dataset */
$myPicture->setFontProperties(array("FontName"=>"/srv/www/lib/pChart/fonts/pf_arma_five.ttf","FontSize"=>6)); /* Choose a nice font */
$myPicture->setGraphArea(130,40,1900,300); /* Define the boundaries of the graph area */
$myPicture->drawScale(array("LabelRotation"=>320)); /* Draw the scale, keep everything automatic */

$Settings = array("R"=>250, "G"=>250, "B"=>250, "Dash"=>1, "DashR"=>0, "DashG"=>0, "DashB"=>0);

/*The combination makes a cool looking graph*/
$myPicture->drawPlotChart();
$myPicture->drawLineChart();
$myPicture->drawLegend(30,320); //adds the legend

//$date-> date("d-M-Y:H:i:s");

//$myPicture->autoOutput(); /* Build the PNG file and send it to the web browser */

$myPicture->render("/opt/bitnami/wordpress/piplanter/renders/".date("d-M-Y_H:i:s").".png");

?>
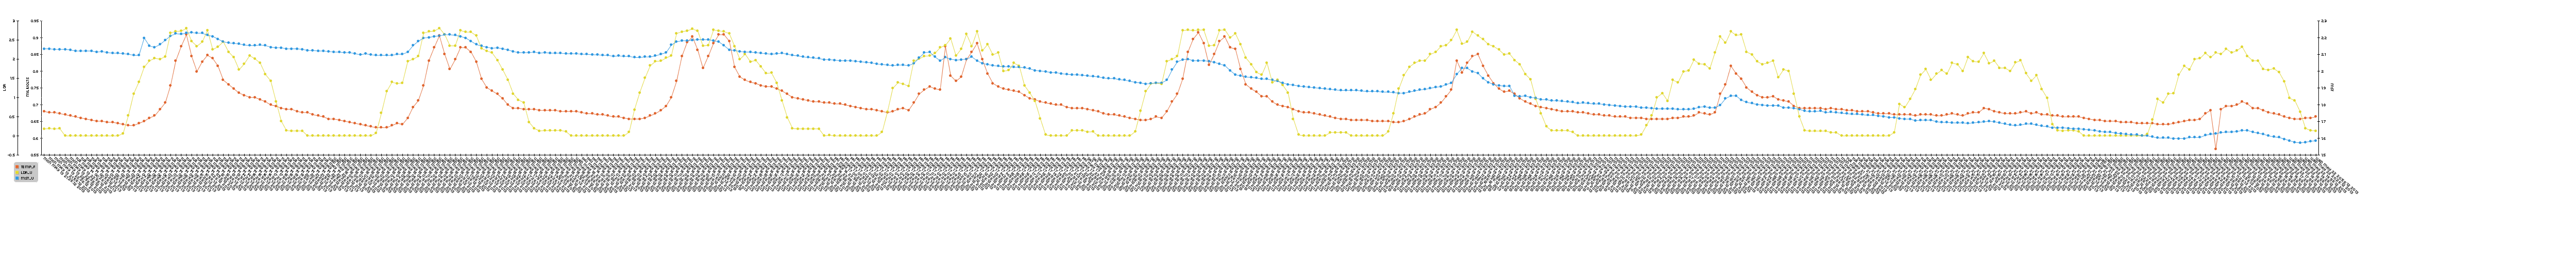
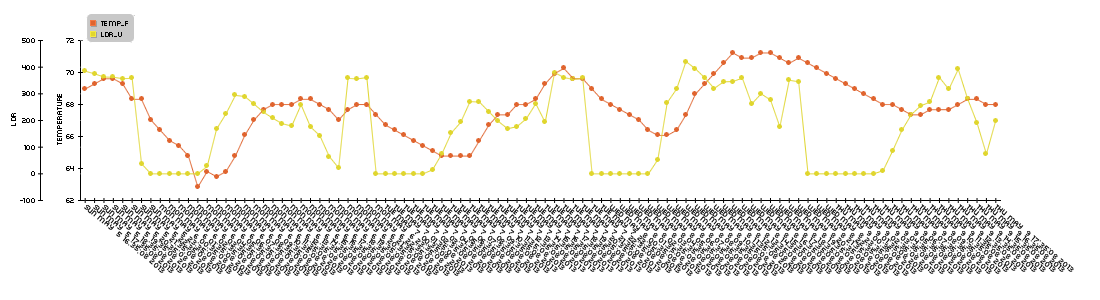
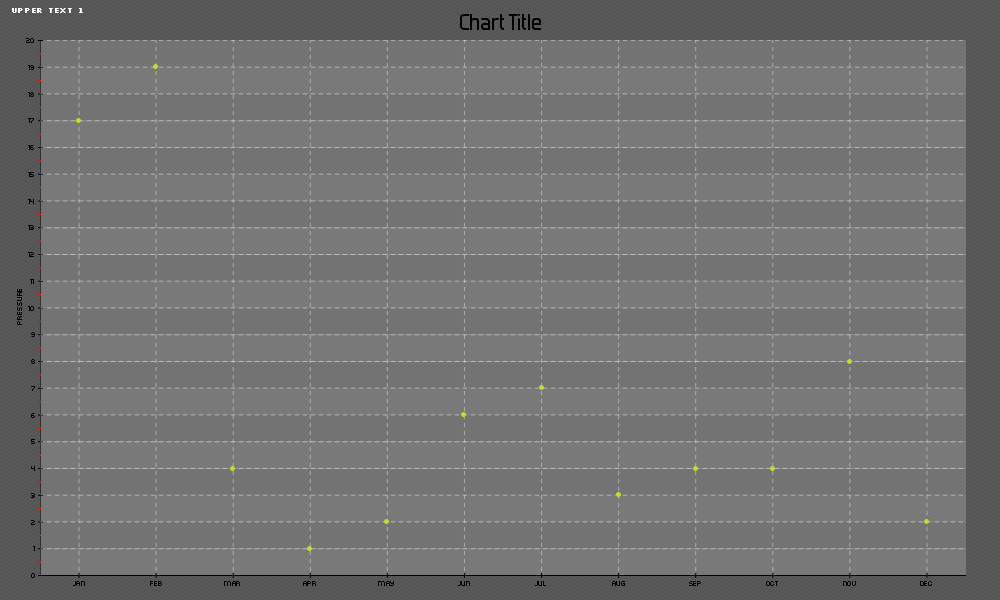
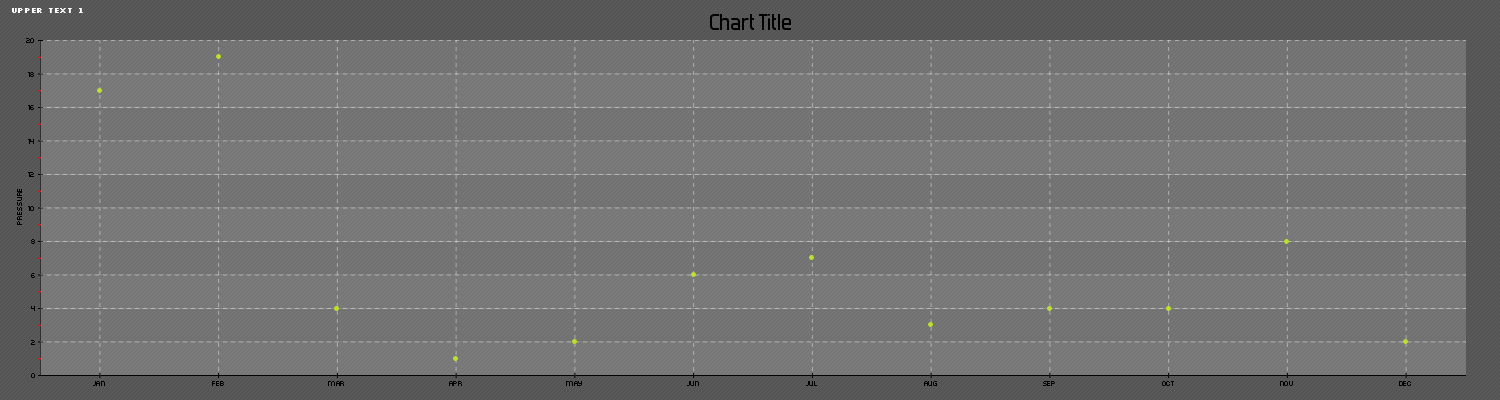
As you may be able to guess, upon the calling of this script, the program looks for a table called “piplanter_table_17” and does a bunch of stuff as commented to produce a graph. This is what a sample graph looks like:
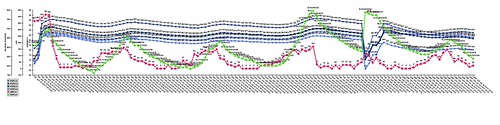
This is data taken over 6 days, and it’s a lot to look at, but it’s good stuff.
Twitter & Flickr Integration
As you hopefully derived from the python code, this project uses Twitter to send data to me. Instead of using an email server or sending sms messages, I decided on twitter because of a few reasons. I use the service constantly, so I won’t ever miss a tweet. The API seemed really easy to use (and it was!) and allowed more than one person to acess the data at any one time. I decided to use flickr as my image hosting service for a lot of the same reasons, but the main one was their 1TB storage per person. You’ve already seen a sample flickr upload, so here’s a sample tweet:
Brghtnss: 2% / Tmprtr: 71 Dg F / Avg Plnt Moisture: 33% Graph: http://t.co/hBuyNQkE7H – http://t.co/H2p1UJx59w
— eso’s rpi (@eso_rpi) June 27, 2013
That’s essentially it! Thank you for reading, and please ask questions.