This is a short post illustrating the process of planting the seeds.


This is a short post illustrating the process of planting the seeds.

Long time viewers will remember when this idea was conceived two Novembers ago, but essentially it’s a way to detect the relative moisture of a substance.
The principal is the same as in the above post, but this time, I made it bigger and attached it to a Raspberry Pi. The reason this is essential, is because I recently purchased a 12v DC pump capable of moving water. I will be able to sense the relative moisture in the plant, and then the plant will be able to water “itself”.
That will be done in python with the same basic technique I’ve been using all along, but in addition to gathering data about the plant every hour or so, it will be able to see if the plant needs water (by checking hopefully an array of moisture sensors) and then turning on the pump and watering it. I will also eventually integrate twitter and a webcam, but those cosmetic editions come once I know the system works.
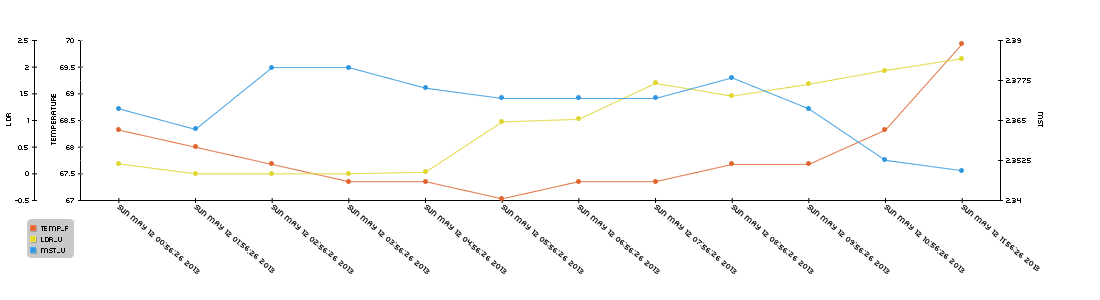
To test it, I’ve added another set of data to the graph as seen in the last post and created a testing environment in my windowsill.
Basically I’ve put some dirt and 100mL of water into a container and inserted the sensor and am monitoring the moisture level over the next n hours, here are some pictures:




And here is a graph of some of the data:
I will make another post later today illustrating the process of plating the seeds.

Time to get this data we’re harvesting graphed. In a couple past posts, I’ve used pChart to graph random data but now since data is getting dumped into a mysql chart, it would make sense to try and graph that data.
To install pChart on my system (same installs as listed in this post) to do that do the following:
First, get the php5-gd package by running:
|
1 |
sudo apt-get install php5-gd |
Then download, rename and move the pChart files to the proper directory:
|
1 2 3 4 |
sudo mkdir /srv/www/lib/ sudo wget http://www.pchart.net/release/pChart2.1.3.tar.gz sudo tar -xzvf pChart2.1.3.tar.gz sudo mv pChart2.1.3 pChart |
Now pChart is ready to be used.
I used a lot of the info found here:
http://wiki.pchart.net/doc.mysql.integration.html
http://wiki.pchart.net/doc.doc.draw.scale.html
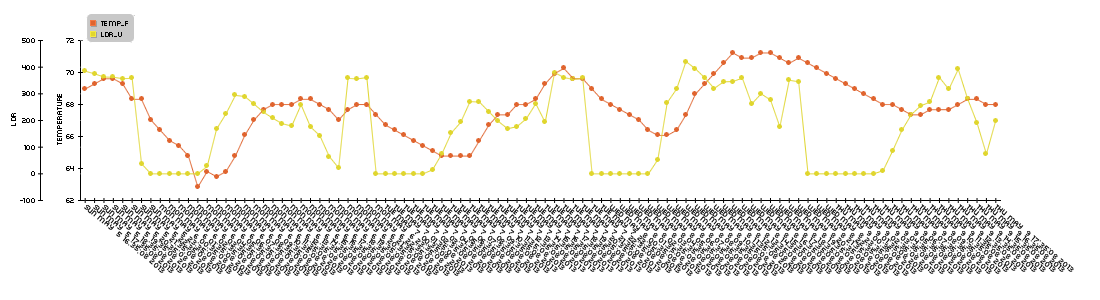
The code is pretty well commented so I’m not really going to get into describing it, but essentially, the following php will retrieve data from a mysql table (which is being populated by a python script seen in this post) and after leaving it on in my room for like 3 days, render this graph:
Here’s that php script:
|
1 2 3 4 5 6 7 8 9 10 11 12 13 14 15 16 17 18 19 20 21 22 23 24 25 26 27 28 29 30 31 32 33 34 35 36 37 38 39 40 41 42 43 44 45 46 47 48 49 50 51 52 53 54 55 56 57 58 59 60 61 62 63 |
<?php /* Include all the classes */ include("/srv/www/lib/pChart/class/pData.class.php"); include("/srv/www/lib/pChart/class/pDraw.class.php"); include("/srv/www/lib/pChart/class/pImage.class.php"); /* Create your dataset object */ $myData = new pData(); $db = mysql_connect("localhost", "piplanter_user", "piplanter_pass"); //location of server, db username, db pass mysql_select_db("piplanter", $db); $Requete = "SELECT * FROM `piplanter_table_05`"; //table name $Result = mysql_query($Requete, $db); /*This fetches the data from the mysql database, and adds it to pchart as points*/ while($row = mysql_fetch_array($Result)) { //$Sample_Number = $row["Sample_Number"]; //Not using this data //$myData->addPoints($Sample_Number,"Sample_Number"); $Time = $row["Time"]; $myData->addPoints($Time,"Time"); $Temp_F = $row["Temp_F"]; $myData->addPoints($Temp_F,"Temp_F"); $LDR_V = $row["LDR_V"]; $myData->addPoints($LDR_V,"LDR_V"); } $myData-> setSerieOnAxis("Temp_F", 0); //assigns the data to the frist axis $myData-> setAxisName(0, "Temperature"); //adds the label to the first axis $myData-> setSerieOnAxis("LDR_V", 1); $myData-> setAxisName(1, "LDR"); $myData-> setAxisPosition(1,AXIS_POSITION_LEFT); //moves the second axis to the far left $myData->setAbscissa("Time"); //sets the time data set as the x axis label $myPicture = new pImage(1100,300,$myData); /* Create a pChart object and associate your dataset */ $myPicture->setFontProperties(array("FontName"=>"/srv/www/lib/pChart/fonts/pf_arma_five.ttf","FontSize"=>6)); /* Choose a nice font */ $myPicture->setGraphArea(80,40,1000,200); /* Define the boundaries of the graph area */ $Settings = array("R"=>250, "G"=>250, "B"=>250, "Dash"=>1, "DashR"=>0, "DashG"=>0, "DashB"=>0); $myPicture->drawScale(array("LabelRotation"=>320)); /* Draw the scale, keep everything automatic */ /*The combination makes a cool looking graph*/ $myPicture->drawPlotChart(); $myPicture->drawLineChart(); $myPicture->drawLegend(90,20); //adds the legend $myPicture->autoOutput(); /* Build the PNG file and send it to the web browser */ ?> |
I’m in a hotel trying to occupy myself with something interesting so I’ve decided to work on this. I had to re-image the SD card I’ve been developing this project on, but I saved to code so there’s no problem there. Now I need to re-install all the basic packages.
First I need to get the components of a LAMP server with the following commands:
|
1 2 3 4 5 |
sudo apt-get install apache2 sudo apt-get install mysql-server sudo apt-get install php5 sudo apt-get install php5-server sudo apt-get install php5-mysql |
Once you get the mysql server setup, you’ll need to create a database and tables in mysql.
To create the database you’ll be using run the following command:
|
1 |
CREATE DATABASE piplanter; |
And then grant the proper privileges to use later with the command:
|
1 2 |
mysql> mysql> GRANT ALL PRIVILEGES ON piplanter.* TO 'user'@'localhost' IDENTIFIED BY 'pass'; FLUSH PRIVILEGES; |
Then we can enter the database and create a table:
|
1 2 |
USE piplanter; CREATE TABLE piplanter_table_01(Sample_Number INT NOT NULL AUTO_INCREMENT PRIMARY KEY, Time VARCHAR(100), Temp_F VARCHAR(100), LDR_V VARCHAR(100) ); |
Now we need to set up the specific libraries for python the first of which being spidev, the spi tool for the raspberry pi which we can grab from git using the following commands:
|
1 2 3 4 5 |
sudo apt-get install git git clone git://github.com/doceme/py-spidev cd py-spidev/ sudo apt-get install python-dev sudo python setup.py install |
You also need to (copied from http://scruss.com/blog/2013/01/19/the-quite-rubbish-clock/):
As root, edit the kernel module blacklist file:
|
1 |
sudo vi /etc/modprobe.d/raspi-blacklist.conf |
Comment out the spi-bcm2708 line so it looks like this:
|
1 |
#blacklist spi-bcm2708 |
Save the file so that the module will load on future reboots. To enable the module now, enter:
|
1 |
sudo modprobe spi-bcm2708 |
We will also need WiringPi:
|
1 2 3 |
sudo apt-get install python-imaging python-imaging-tk python-pip python-dev git sudo pip install spidev sudo pip install wiringpi |
Then you need to get APscheduler, the timing program used to execute the incremental timing with the following commands:
|
1 2 3 |
wget https://pypi.python.org/packages/source/A/APScheduler/APScheduler-2.1.0.tar.gz sudo tar -xzvf APScheduler-2.1.0.tar.gz python setup.py install |
You will need mysqldb to interface python and mysql:
|
1 |
sudo apt-get install python-mysqldb |
Once you reboot, the following program should work:
|
1 2 3 4 5 6 7 8 9 10 11 12 13 14 15 16 17 18 19 20 21 22 23 24 25 26 27 28 29 30 31 32 33 34 35 36 37 38 39 40 41 42 43 44 45 46 47 48 49 50 51 52 53 54 55 56 57 58 59 60 61 62 63 64 65 66 67 68 69 70 71 72 73 74 75 76 77 78 79 80 81 82 |
#Timing setup from datetime import datetime from apscheduler.scheduler import Scheduler import time import datetime import sys now =datetime.datetime.now() import logging #if you start getting logging errors, uncomment these two lines logging.basicConfig() #GPIO setup import RPi.GPIO as GPIO GPIO.setmode(GPIO.BOARD) GPIO.cleanup() pin = 26 #pin for the adc GPIO.setup(pin, GPIO.OUT) led1 = 11 #pin for the short indicator led GPIO.setup(led1, GPIO.OUT) led2 = 13 #pin for other long indicator led GPIO.setup(led2, GPIO.OUT) #the adc's SPI setup import spidev spi = spidev.SpiDev() spi.open(0, 0) import MySQLdb con = MySQLdb.connect('localhost','piplanter_user','piplanter_pass','piplanter'); cursor = con.cursor() #fuction that can read the adc def readadc(adcnum): # read SPI data from MCP3008 chip, 8 possible adc's (0 thru 7) if adcnum > 7 or adcnum < 0: return -1 r = spi.xfer2([1, 8 + adcnum << 4, 0]) adcout = ((r[1] & 3) << 8) + r[2] return adcout def rapidSample(): sampleTime = time.ctime() sampleTemp1 = (((readadc(0)*3.3)/1024)/(10.0/1000)) #this translates the analog voltage to temperature in def F sampleLght1 = readadc(1) samplePot1 = readadc(2) GPIO.output(led1, True) #turns the led on time.sleep(.1) #sleeps a little bit so you can see the LED on print "Job 1", sampleTime,"LDR:",sampleLght1 ,"Pot:",samplePot1,"Temp:",sampleTemp1 #prints the debug info cursor.execute("INSERT INTO piplanter_table_02(Time,Temp_F,LDR_V) VALUES(%s,'%s','%s')",(sampleTime,sampleTemp1,sampleLght1)) con.commit() #this is important for live updating time.sleep(.1) GPIO.output(led1, False) #turns the led off def slowSample(): sampleTime = time.ctime() sampleTemp1 = (((readadc(0)*3.3)/1024)/(10.0/1000)) #this translates the analog voltage to temperature in def F sampleLght1 = readadc(1) samplePot1 = readadc(2) GPIO.output(led2, True) #turns the led on time.sleep(5) print "Job 2", sampleTime,"LDR:",sampleLght1 ,"Pot:",samplePot1,"Temp:",sampleTemp1 #prints the debug info cursor.execute("INSERT INTO piplanter_table_03(Time,Temp_F,LDR_V) VALUES(%s,'%s','%s')",(sampleTime,sampleTemp1,sampleLght1)) con.commit() #this is important for live updating time.sleep(5) GPIO.output(led2, False) #turns the led on if __name__ == '__main__': #the following 3 lines start up the interval job and keep it going scheduler = Scheduler(standalone=True) scheduler.add_interval_job(rapidSample, minutes=1) scheduler.add_interval_job(slowSample, hours=1) scheduler.start() |
And there you go! The program should log data every minute and then every hour to two different tables. To view those data sets as php tables you can use this php script:
|
1 2 3 4 5 6 7 8 9 10 11 12 13 14 15 16 17 18 19 20 21 22 23 24 25 26 |
<?php mysql_connect("localhost", "piplanter_user","piplanter_pass") or die ("Could not connect: " . mysql_error()); mysql_select_db("piplanter"); $result = mysql_query("SELECT * FROM piplanter_table_02"); echo "<table border='1'> <tr> <th>Sample_Number</th> <th>Time</th> <th>Temp F</th> <th>LDR Value V</th> </tr>"; while($row = mysql_fetch_array($result)){ echo"<tr>"; echo"<td>" . $row['Sample_Number'] . "</td>"; echo"<td>" . $row['Time'] . "</td>"; echo"<td>" . $row['Temp_F'] . "</td>"; echo"<td>" . $row['LDR_V'] . "</td>"; echo"</tr>"; } echo "</table>"; mysql_close($con); ?> |
Sometime later I’ll get to graphing the data.
I’m taking a “break” from my drone while I save some money to buy more tricopter parts, and since the weather’s getting nicer and nicer I’ve decided to start working on my PiPlanter again.
As a refresher, the PiPlanter is a Raspberry Pi powered garden. The goal is for it to just be able to be plugged in and add water to a water source and have the Pi monitor temp and moisture levels to be able to add more water as needed.
I’ve shown that is relatively easy to go from analog sensors to good looking tables and graphs using the raspberry pi, the problem that I ran into however was timing.
It became harder and harder to use the time.sleep function in python to handle long periods of time. When you are dealing with things like plants, you don’t need to water it very often, but for data’s sake, you should be polling the sensors a lot.
I’ve landed on the use of APScheduler in python, and here’s my source code:
[py]
#Timing setup
from datetime import datetime
from apscheduler.scheduler import Scheduler
import time
import logging #if you start getting logging errors, uncomment these two lines
logging.basicConfig()
#GPIO setup
import RPi.GPIO as GPIO
GPIO.setmode(GPIO.BOARD)
GPIO.cleanup()
pin = 26 #pin for the adc
GPIO.setup(pin, GPIO.OUT)
led1 = 11 #pin for the short indicator led
GPIO.setup(led1, GPIO.OUT)
led2 = 13 #pin for other long indicator led
GPIO.setup(led2, GPIO.OUT)
#the adc’s SPI setup
import spidev
spi = spidev.SpiDev()
spi.open(0, 0)
going = True
#fuction that can read the adc
def readadc(adcnum):
# read SPI data from MCP3008 chip, 8 possible adc’s (0 thru 7)
if adcnum > 7 or adcnum < 0:
return -1
r = spi.xfer2([1, 8 + adcnum << 4, 0])
adcout = ((r[1] & 3) << 8) + r[2]
return adcout
def rapidSample():
sampleTemp1 = (((readadc(0)*3.3)/1024)/(10.0/1000)) #this translates the analog voltage to temperature in def F
sampleLght1 = readadc(1)
samplePot1 = readadc(2)
GPIO.output(led1, True) #turns the led on
time.sleep(.1) #sleeps a little bit so you can see the LED on
print “Job 1″, datetime.now(),”LDR:”,sampleLght1 ,”Pot:”,samplePot1,”Temp:”,sampleTemp1 #prints the debug info
time.sleep(.1)
GPIO.output(led1, False) #turns the led off
def slowSample():
print “Job 2” , datetime.now()
GPIO.output(led2, True) #turns the led on
time.sleep(5)
GPIO.output(led2, False) #turns the led on
if __name__ == ‘__main__’:
#the following 3 lines start up the interval job and keep it going
scheduler = Scheduler(standalone=True)
scheduler.add_interval_job(rapidSample, seconds=1)
scheduler.add_interval_job(slowSample, minutes=1)
scheduler.start()
[/py]
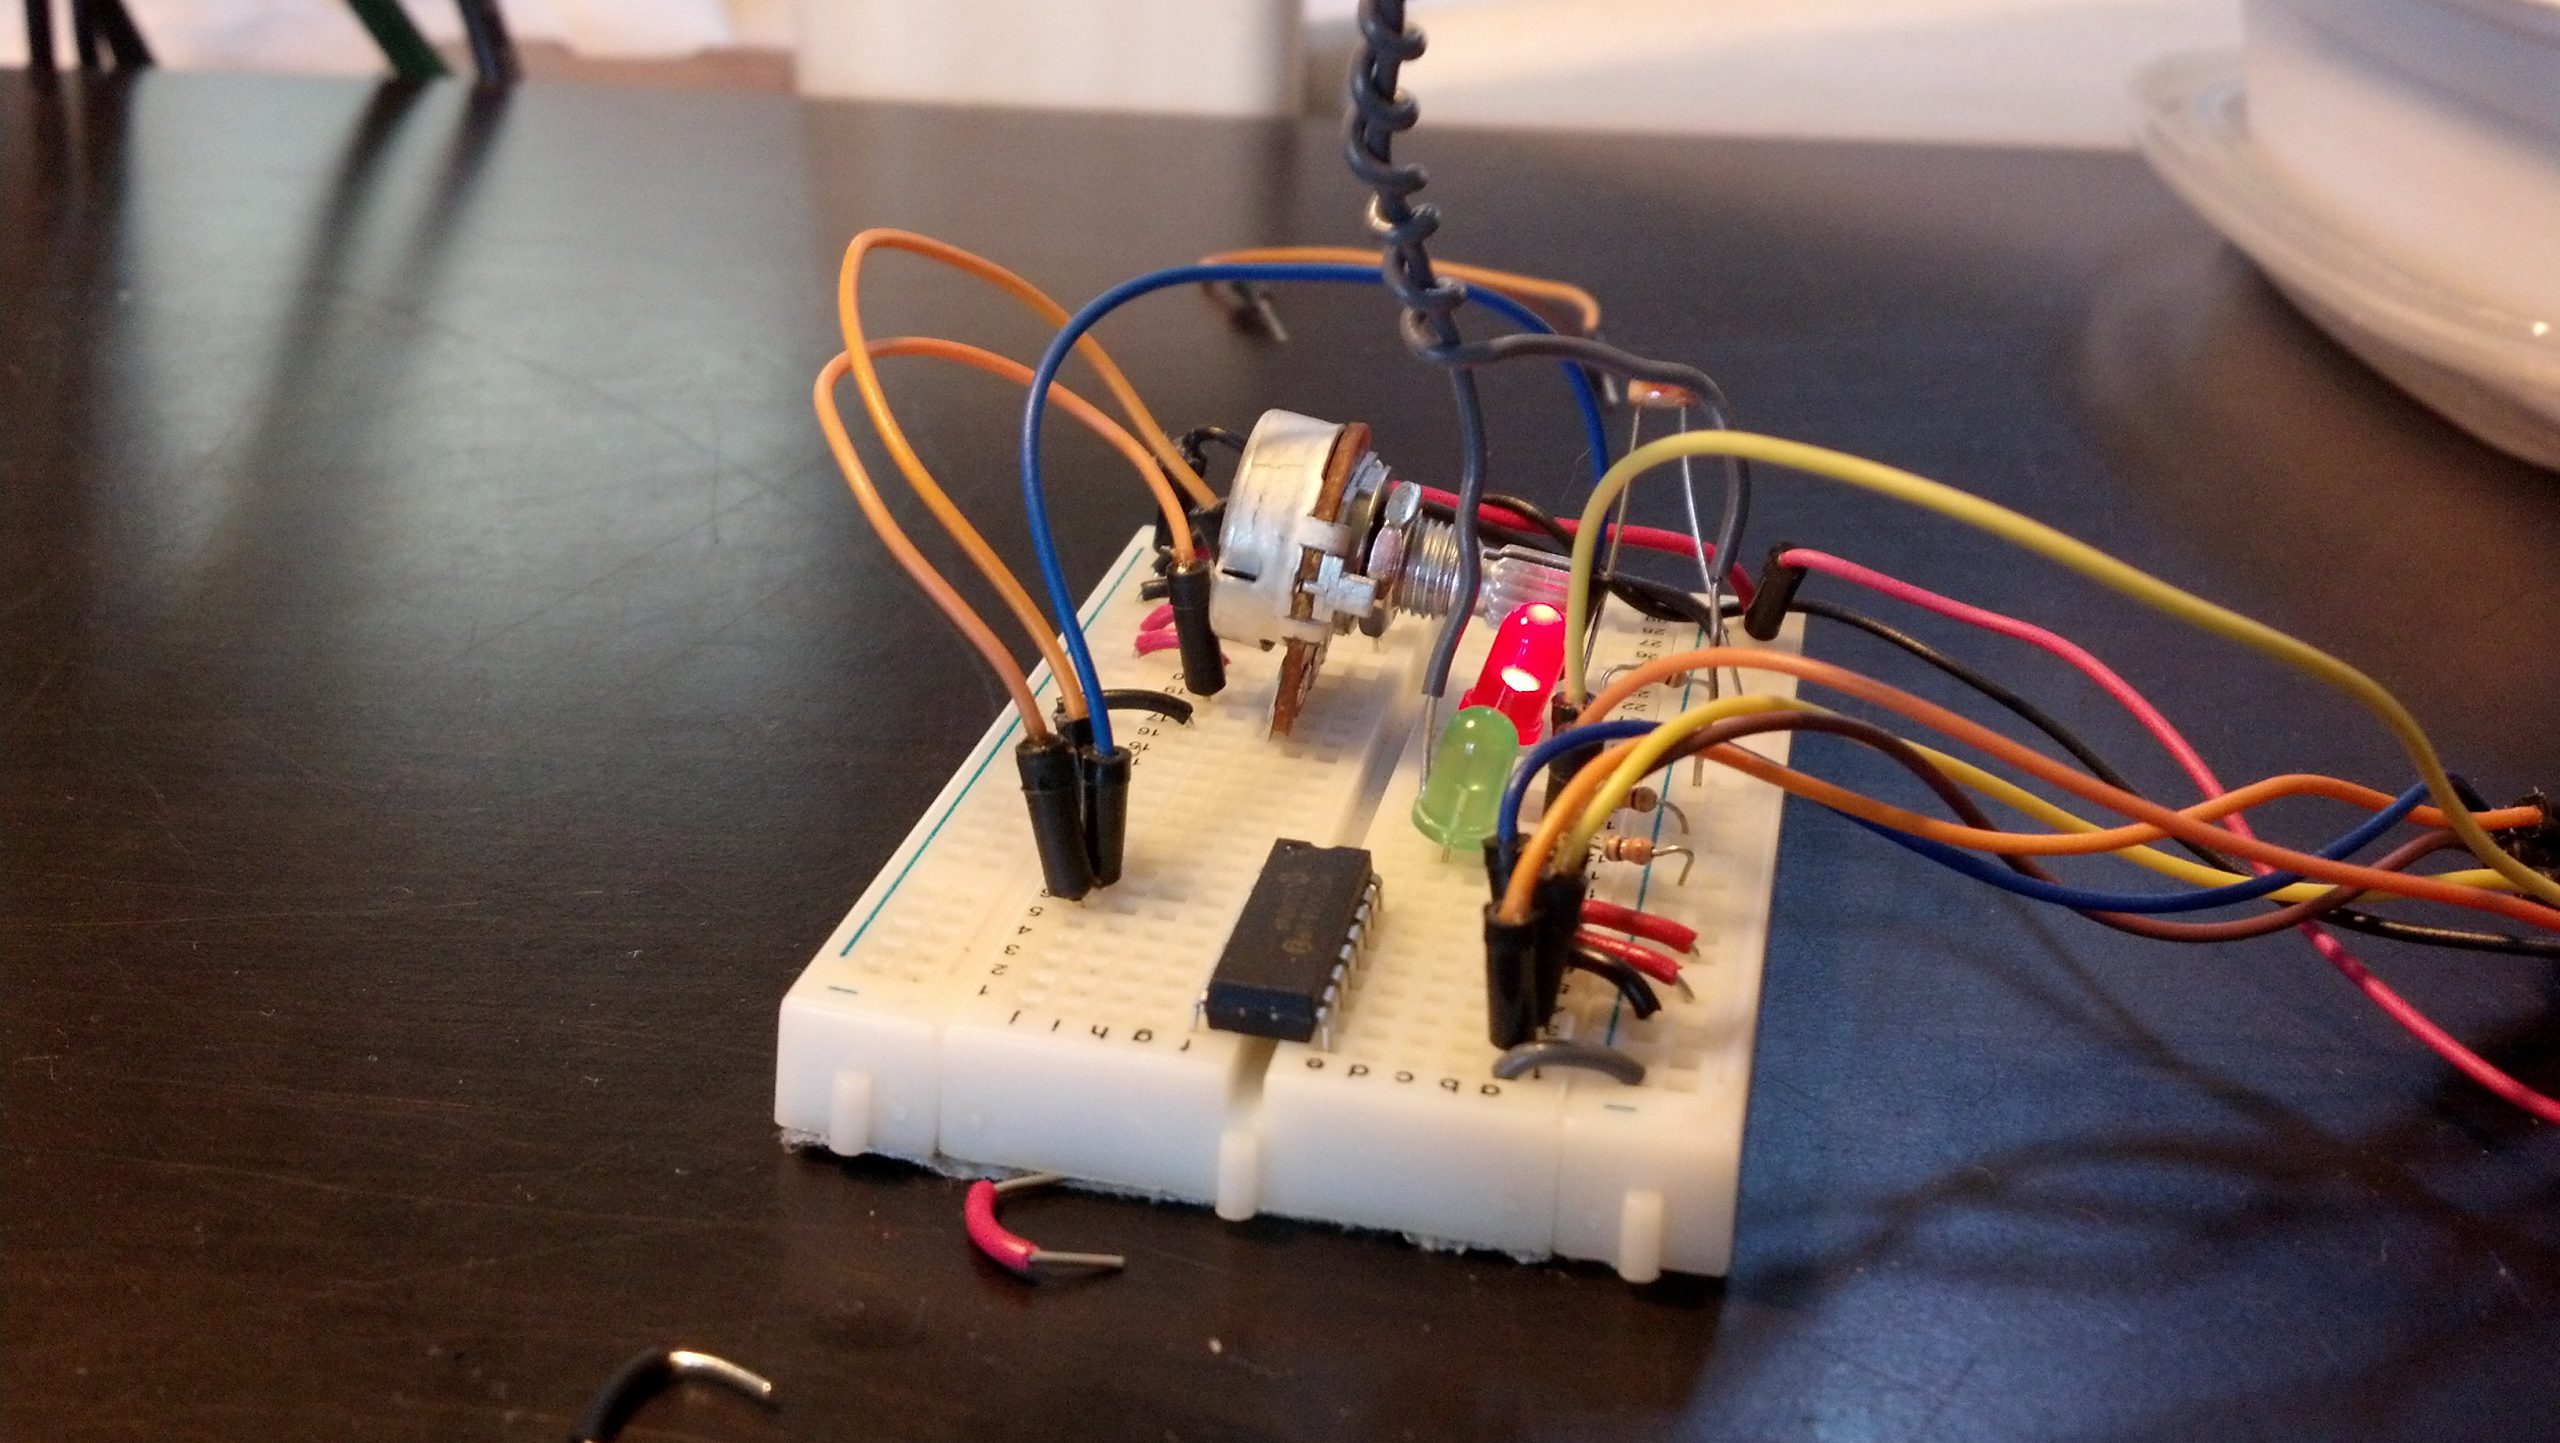
This produces a loop that flashed a green led on and of for .1 seconds at a time per second, and then every minute, turns on a speaker and a red led for 5 seconds then turns it off. There are some images of what goes on below.
Here is a picture of the the print dialog in python:
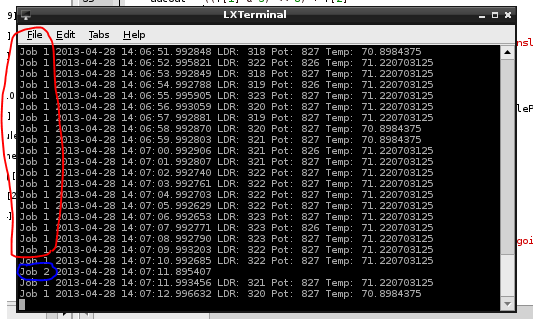
You can see that the first job (green led) posts the values from the analog sensors every second
The second job (red led) just posts the time. But the function is expandable to do anything at any time.
Here are pictures of the board and the circuit in action:
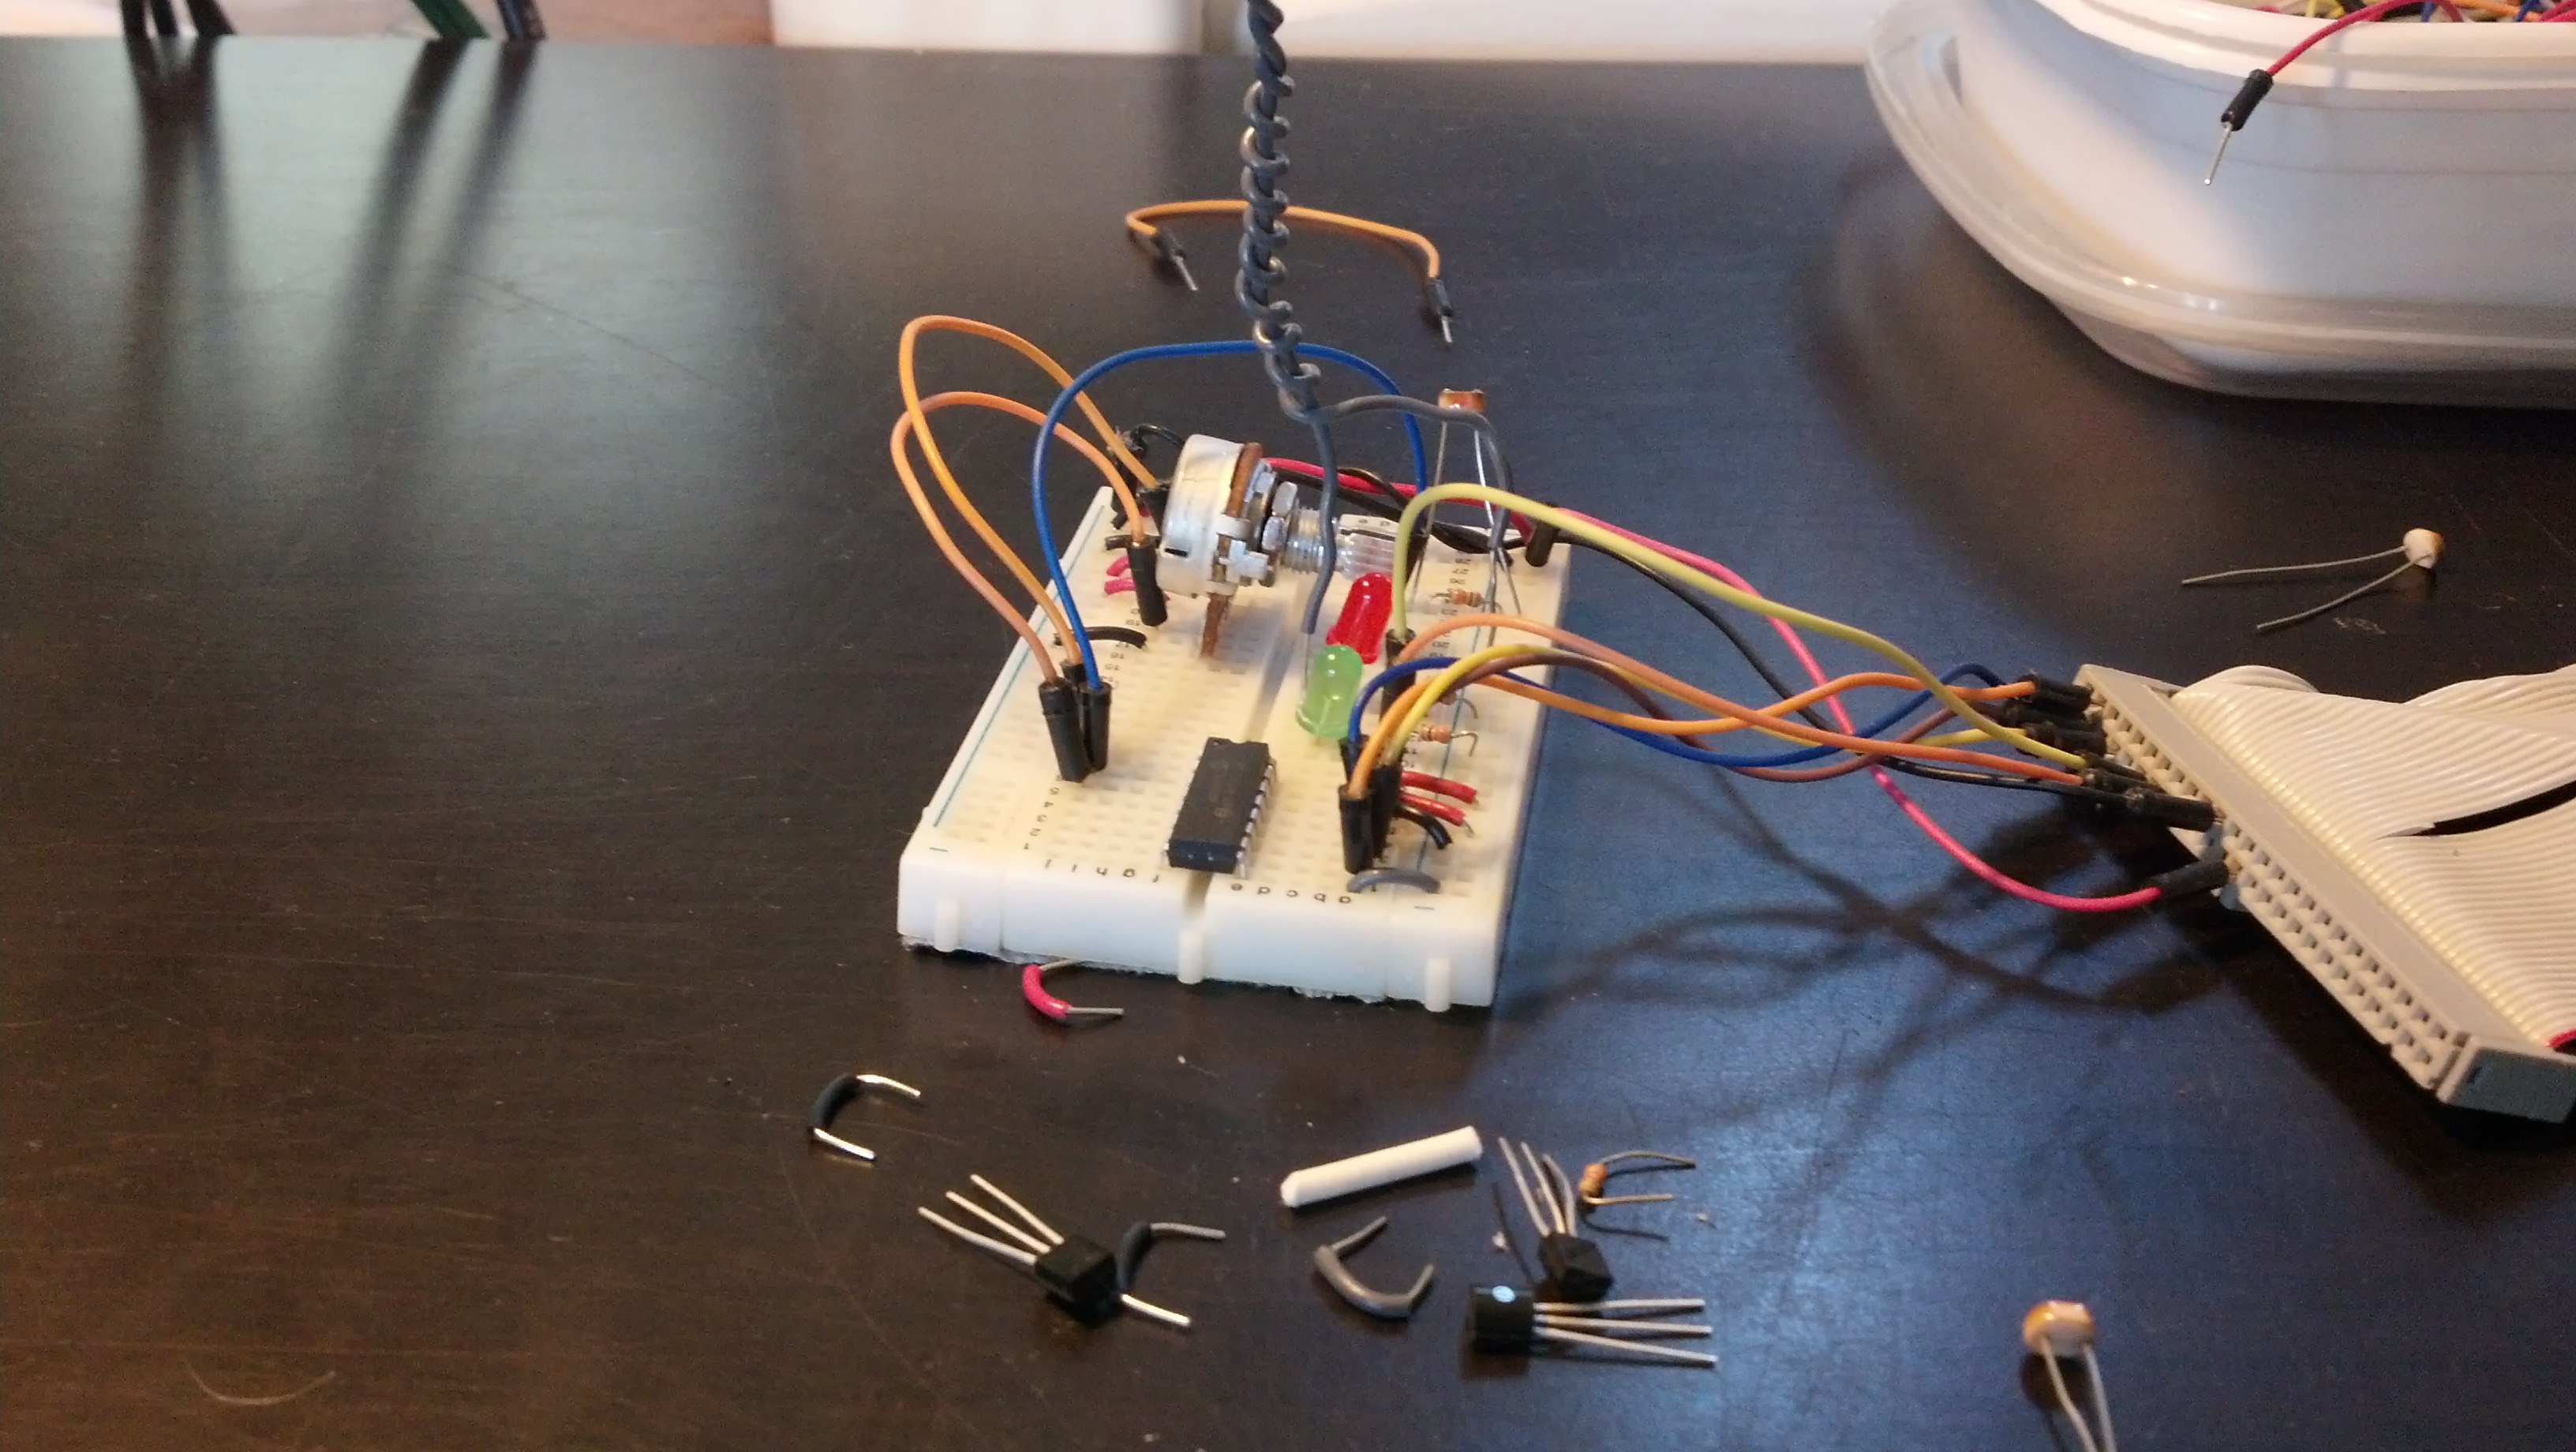
Both LED’s off
The Green LED on, the red circled process in the printout
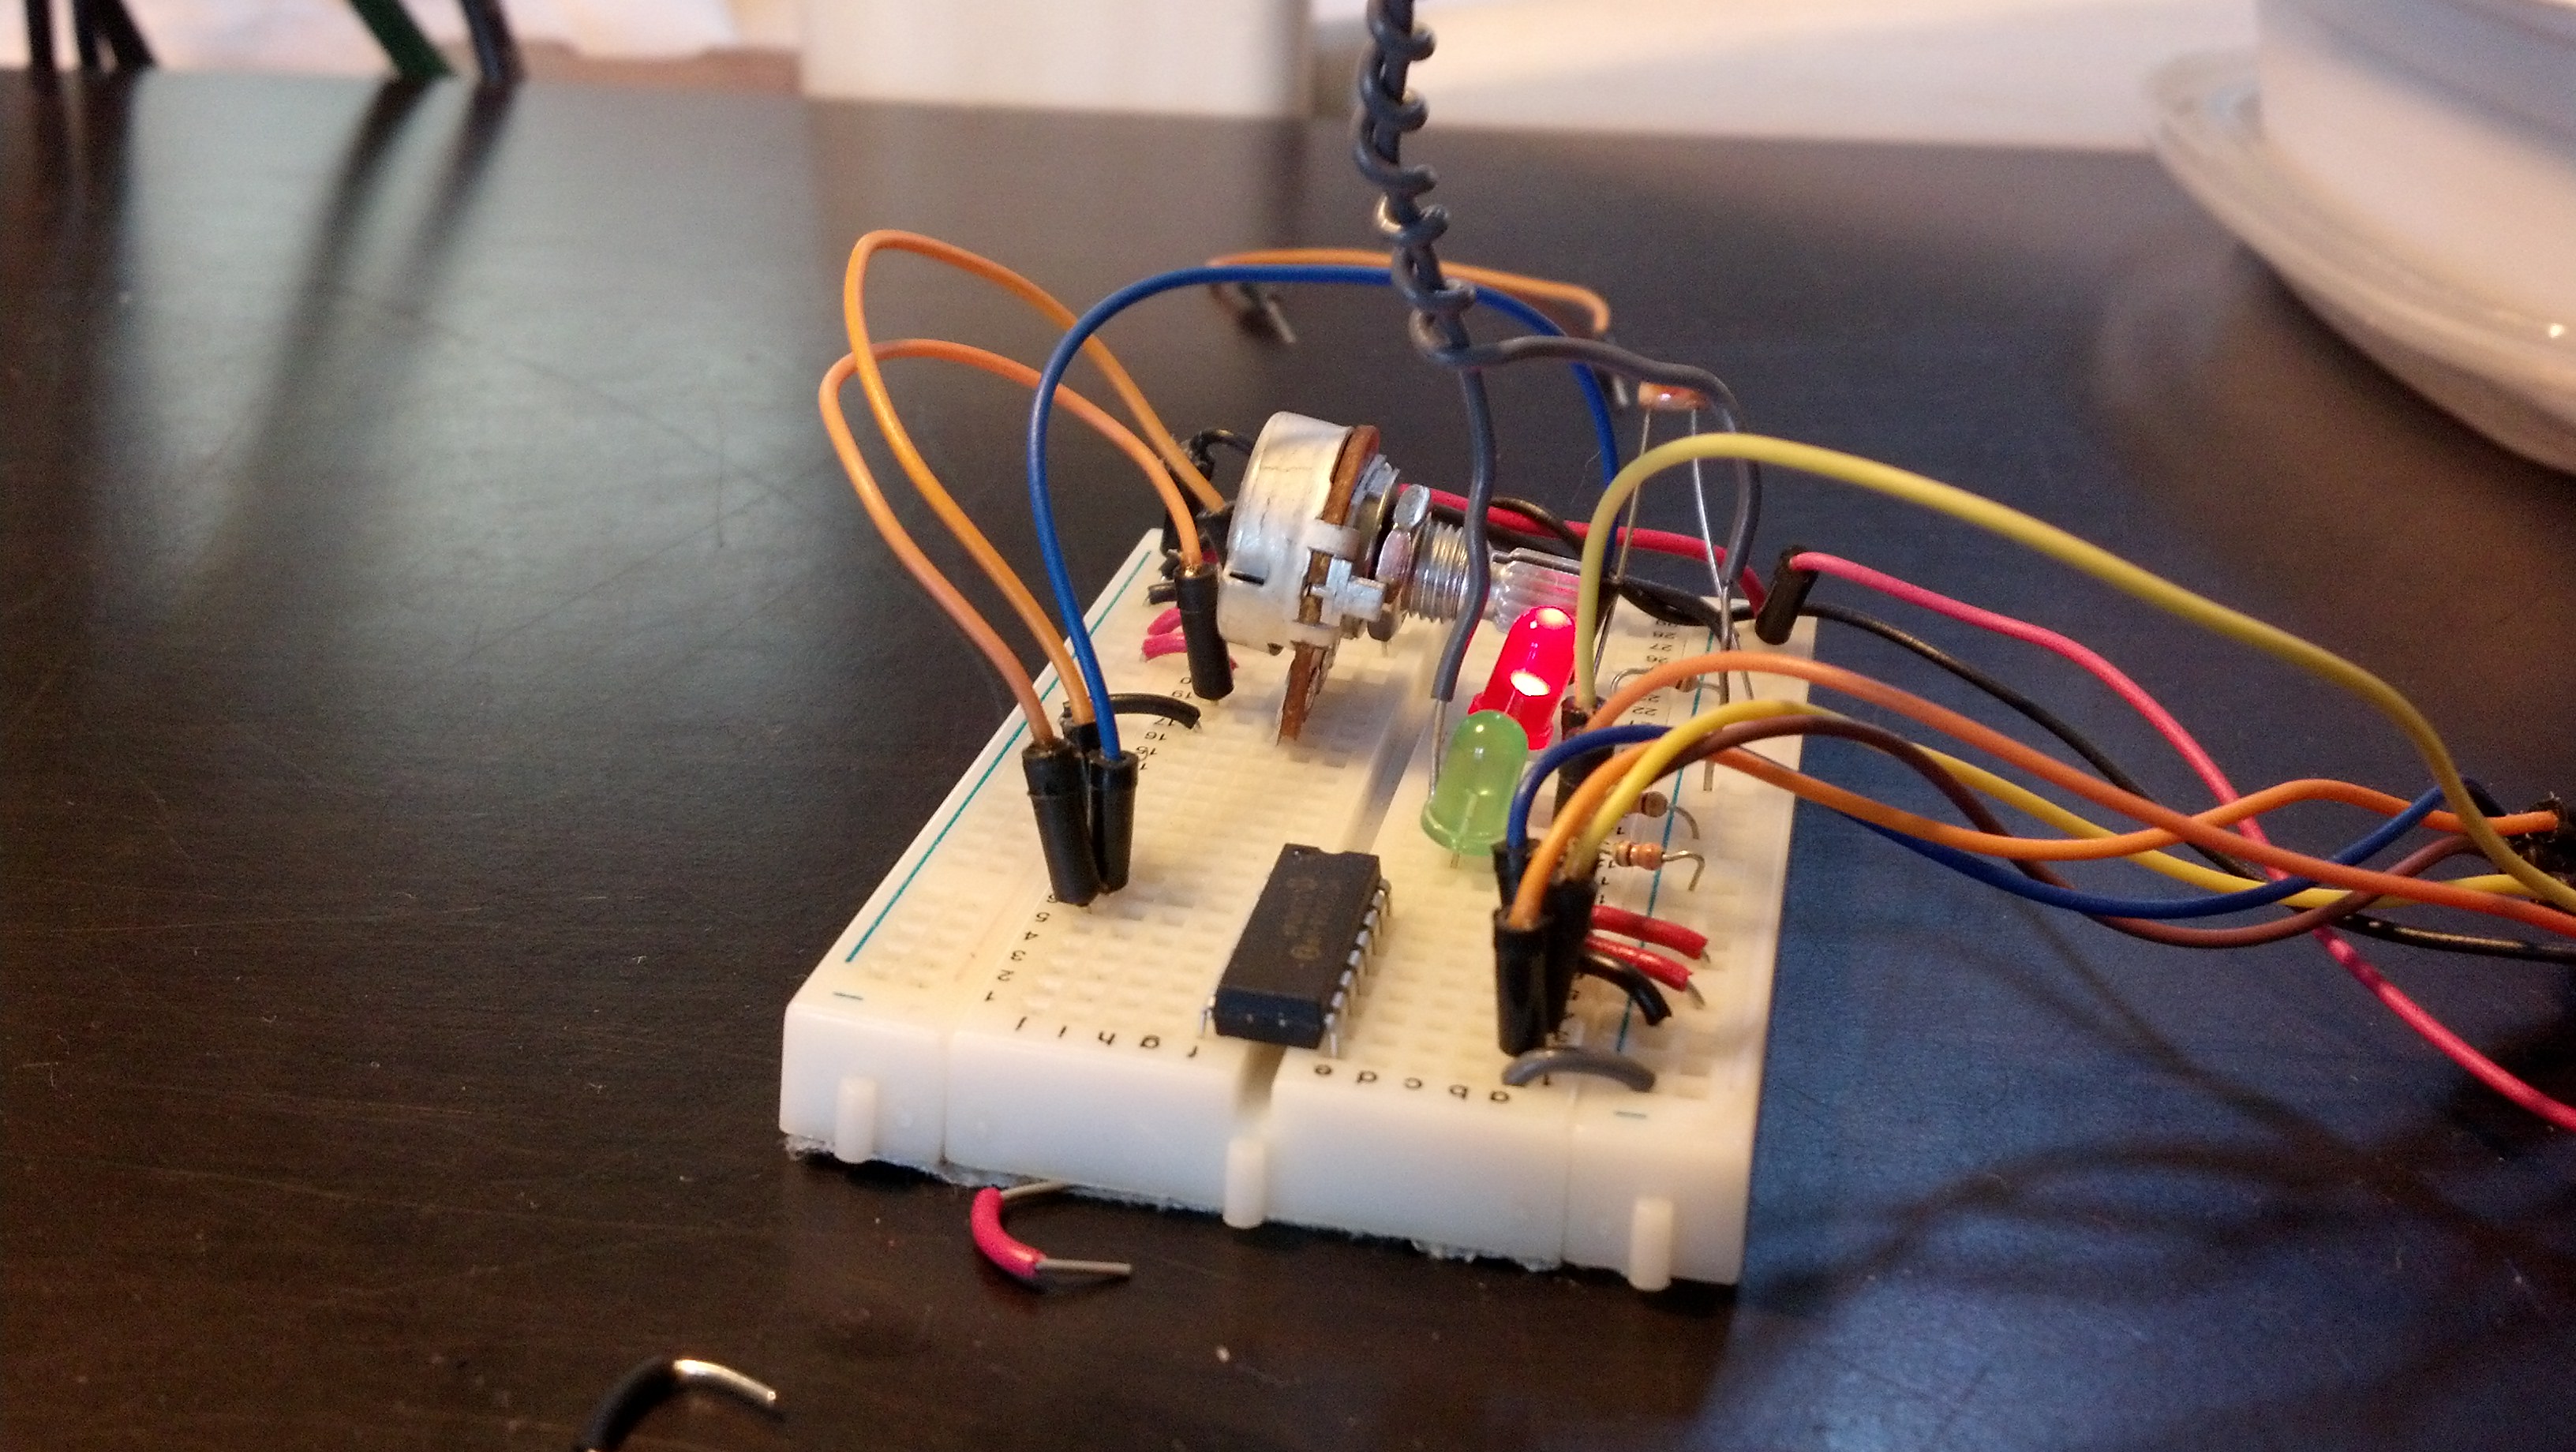
Here are both on
The next step is adding the mySQL in as seen in some other posts.
Here’s a video:
|
1 |
CREATE TABLE adc_input_data_10(Sample_Number INT NOT NULL AUTO_INCREMENT PRIMARY KEY, Time VARCHAR(100), Channel_1 VARCHAR(100), Channel_2 VARCHAR(100), Channel_3 VARCHAR(100) ); |
|
1 2 3 4 5 6 7 8 9 10 11 12 13 14 15 16 17 18 19 20 21 22 23 24 25 26 27 28 29 30 31 32 33 34 35 36 37 38 39 40 41 42 43 |
#!/usr/bin/env python # -*- coding: utf-8 -*- import spidev import time import MySQLdb import sys import RPi.GPIO as GPIO import datetime now = datetime.datetime.now() pin = 26 GPIO.setmode(GPIO.BOARD) GPIO.setup(pin, GPIO.OUT) con = MySQLdb.connect('localhost','adc_user','adc_user_pass','adc_database'); cursor = con.cursor() spi = spidev.SpiDev() spi.open(0, 0) maxcyclenumber = 10 count = 0 def readadc(adcnum): # read SPI data from MCP3008 chip, 8 possible adc's (0 thru 7) if adcnum > 7 or adcnum < 0: return -1 r = spi.xfer2([1, 8 + adcnum << 4, 0]) adcout = ((r[1] & 3) << 8) + r[2] return adcout for _ in range(maxcyclenumber): cursor.execute("INSERT INTO adc_input_data_10(Time,Channel_1,Channel_2,Channel_3) VALUES(%s,'%s','%s','%s')",(datetime.datetime.now().strftime('%b-%d-%I%M%p-%G'),readadc(0),readadc(1),readadc(2)) ) con.commit() #this is important for live updating count = count+1 print count time.sleep (1) if count == maxcyclenumber: GPIO.cleanup() con.close()</pre> |
|
1 2 3 4 5 6 7 8 9 10 11 12 13 14 15 16 17 18 19 20 21 22 23 24 25 26 27 28 |
<?php mysql_connect("localhost", "adc_user","adc_user_pass") or die ("Could not connect: " . mysql_error()); mysql_select_db("adc_database"); $result = mysql_query("SELECT * FROM adc_input_data_10"); echo "<table border='1'> <tr> <th>Sample Number</th> <th>Time</th> <th>Channel 1</th> <th>Channel 2</th> <th>Channel 3</th> </tr>"; while($row = mysql_fetch_array($result)){ echo"<tr>"; echo"<td>" . $row['Sample_Number'] . "</td>"; echo"<td>" . $row['Time'] . "</td>"; echo"<td>" . $row['Channel_1'] . "</td>"; echo"<td>" . $row['Channel_2'] . "</td>"; echo"<td>" . $row['Channel_3'] . "</td>"; echo"</tr>"; } echo "</table>"; mysql_close($con); ?> |

This is a much more refined version of that graph I created earlier.
This one is much more detailed, and the sizes of the graph can easily be controlled with the imageSizeX and Y Vals.
This program will render:
|
1 2 3 4 5 6 7 8 9 10 11 12 13 14 15 16 17 18 19 20 21 22 23 24 25 26 27 28 29 30 31 32 33 34 35 36 37 38 39 40 41 42 43 44 45 46 47 48 49 50 51 |
<?php /* CAT:Scaling */ /* pChart library inclusions */ include("/srv/www/lib/pChart/class/pData.class.php"); include("/srv/www/lib/pChart/class/pDraw.class.php"); include("/srv/www/lib/pChart/class/pImage.class.php"); $imageSizeXXal = 1000; $imageSizeYVal = 600; /* Create and populate the pData object */ $MyData = new pData(); $MyData->addPoints(array(17,19,4,1,2,6,7,3,4,4,8,2),"Pressure"); $MyData->setSerieDrawable("Pressure",FALSE); $MyData->setAxisName(0,"Temperatures"); $MyData->addPoints(array("Jan","Feb","Mar","Apr","May","Jun","Jul","Aug","Sep","Oct","Nov","Dec"),"Labels"); $MyData->setSerieDescription("Labels","Months"); $MyData->setAbscissa("Labels"); /* Create the pChart object */ $myPicture = new pImage($imageSizeXXal,$imageSizeYVal,$MyData); //size of the graph box /* Draw the background */ $Settings = array("R"=>84, "G"=>84, "B"=>84, "Dash"=>1, "DashR"=>95, "DashG"=>95, "DashB"=>95); $myPicture->drawFilledRectangle(0,0,$imageSizeXXal+5,$imageSizeYVal,$Settings); //size of the grey background /* Write the picture title */ $myPicture->setFontProperties(array("FontName"=>"/srv/www/lib/pChart/fonts/Silkscreen.ttf","FontSize"=>6)); $myPicture->drawText(10,13,"Upper Text 1",array("R"=>255,"G"=>255,"B"=>255)); /* Write the chart title */ $myPicture->setFontProperties(array("FontName"=>"/srv/www/lib/pChart/fonts/Forgotte.ttf","FontSize"=>11)); $myPicture->drawText($imageSizeXXal/2,30,"Chart Title",array("FontSize"=>20,"Align"=>TEXT_ALIGN_BOTTOMMIDDLE)); /* Define the 2nd chart area */ $myPicture->setGraphArea(40,40,$imageSizeXXal-35,$imageSizeYVal-25); //top left, then bottom right conrner of box $myPicture->setFontProperties(array("FontName"=>"/srv/www/lib/pChart/fonts/pf_arma_five.ttf","FontSize"=>6)); /* Draw the scale */ $scaleSettings = array("DrawSubTicks"=>TRUE,"CycleBackground"=>TRUE); $MyData->setSerieDrawable("Temperature",FALSE); $MyData->setSerieDrawable("Pressure",TRUE); $MyData->setAxisName(0,"Pressure"); $myPicture->drawScale($scaleSettings); $myPicture->drawPlotChart(); /* Render the picture (choose the best way) */ $myPicture->autoOutput(); ?> |
This image:
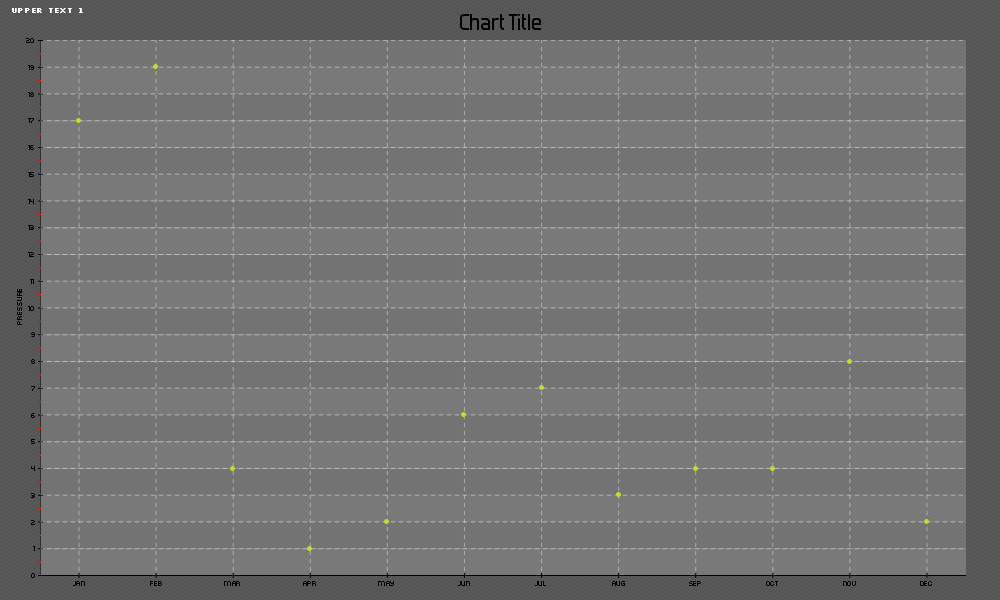
And by modifying the values mentioned above to:
|
1 2 |
$imageSizeXXal = 1500; $imageSizeYVal = 400; |
You will get this image:
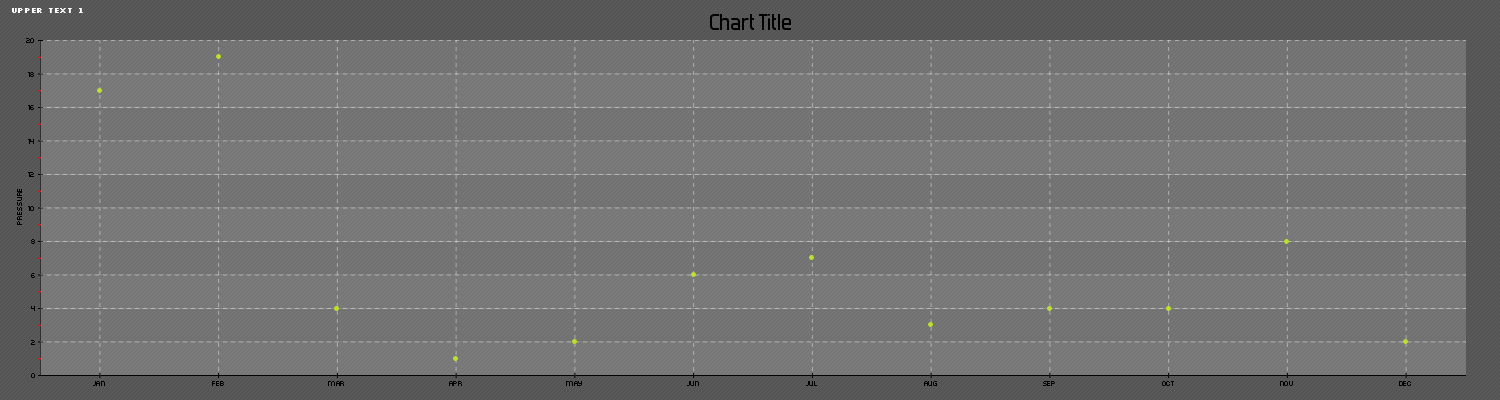

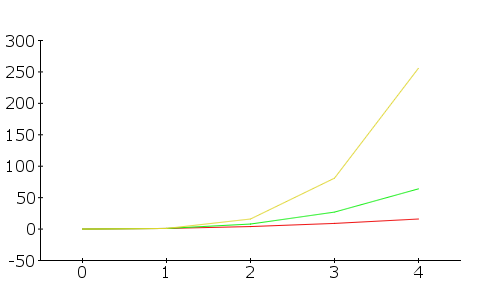
Again, short post. This php code:
|
1 2 3 4 5 6 7 8 9 10 11 12 13 14 15 16 17 18 19 20 21 22 23 24 25 26 27 28 29 30 31 32 |
<?php session_start(); require_once "/srv/www/lib/pChart/class/pDraw.class.php"; require_once "/srv/www/lib/pChart/class/pImage.class.php"; require_once "/srv/www/lib/pChart/class/pData.class.php"; $squareSeries = array(); $cubeSeries = array(); $fourthSeries = array(); for ($i = 0; $i <= 4; $i++){ $squareSeries[$i] = pow($i,2); $cubeSeries[$i] = pow($i,3); $fourthSeries[$i] = pow($i, 4); } $myPowersData = new pData(); $myPowersData -> addPoints($squareSeries,"Square"); $myPowersData -> addPoints($cubeSeries,"Cube"); $myPowersData -> addPoints($fourthSeries,"Fourth"); $myPowersData-> setPalette("Square", array("R" => 240, "G" => 16, "B" => 16, "Alpha" => 100)); $myPowersData-> setPalette("Cube", array("R" => 16, "G" => 240, "B" => 16, "Alpha" => 100)); $myPowersData-> setPalette("Forth", array("R" => 16, "G" => 16, "B" => 240, "Alpha" => 100)); $myPowersImage = new pImage(500,300, $myPowersData); $myPowersImage -> setFontProperties(array( "FontName" => "/srv/www/lib/pChart/fonts/verdana.ttf", "FontSize" => 12)); $myPowersImage->setGraphArea(40,40, 460,260); $myPowersImage->drawScale(); $myPowersImage->drawLineChart(); header("Content-Type: image/png"); $myPowersImage->Render(null); |
will produce this graph:
I learned this using this resource:
http://phpmaster.com/charting-with-pchart/
As this post is more of an update, I won’t be adding any explanations, just giving the python code.
This will read 3 values from the adc and put them into the database “adc_database”. It will put them in the table “adc_input_data_4” in the columns “Channel_1″,”Channel_2” and “Channel_3” respectively.
|
1 2 3 4 5 6 7 8 9 10 11 12 13 14 15 16 17 18 19 20 21 22 23 24 25 26 27 28 29 30 31 32 33 34 35 36 37 38 39 40 41 42 43 44 45 46 |
#!/usr/bin/env python # -*- coding: utf-8 -*- import spidev import time import MySQLdb import sys import RPi.GPIO as GPIO pin = 26 GPIO.setmode(GPIO.BOARD) GPIO.setup(pin, GPIO.OUT) con = MySQLdb.connect('localhost','adc_user','adc_user_pass','adc_database'); cursor = con.cursor() spi = spidev.SpiDev() spi.open(0, 0) count = 0 maxcyclenumber = 5 tmp = "derp" def readadc(adcnum): # read SPI data from MCP3008 chip, 8 possible adc's (0 thru 7) if adcnum > 7 or adcnum < 0: return -1 r = spi.xfer2([1, 8 + adcnum << 4, 0]) adcout = ((r[1] & 3) << 8) + r[2] return adcout for _ in range(maxcyclenumber): GPIO.output(pin,True) cursor.execute("INSERT INTO adc_input_data_4(Channel_1,Channel_2,Channel_3) VALUES('%s','%s','%s')",(readadc(0),readadc(1),readadc(2)) ) GPIO.output(pin,False) count = count+1 print count time.sleep (1) if count == maxcyclenumber: GPIO.cleanup() con.commit() con.close() |
There you go, bigger post coming later tonight.
Please note that this is more for my sake. To mount a hard drive in raspbian do the following: Make sure you have ntfs-3g installed by running:
|
1 |
sudo apt-get install ntfs-3g |
Then mount the drive read/write with the following command:
|
1 2 |
sudo mkdir /media/USBHDD sudo mount -t ntfs-3g /dev/sda1/ /media/USBHDD/ |
And it shout be mounted. /dev/sda1 is the location of your hard drive. Now to configuring minidlna. Location of minidlna.conf file and access command:
|
1 |
sudo vi /etc/minidlna.conf |
This is the file I’m running right now. As I type this i’m successfully streaming to my Kindle Fire HD (the reason why I’ve decided to really make this thing work) but I’m not sure if it’s stable. It’s also able to stream to VLC as of now.