
Previously a plan was set in motion to benchmark my collection of mighty Tesla GPUs. The set of cooler manifolds are designed, a GPU server benchmark suite has been created, and the time has come to start working through the spreadsheet. I have long suspected that the older multi node cards could be fantastic for image processing. Finally we can quantify how much life is left in these older cards.
GPU Box Benchmark
To automate the benchmarking process, I created gpu_box_benchmark. Many standard GPU benchmarks out there don’t simultaneously run on multiple GPUs. This makes a lot of sense because they’re designed to compare individual GPUs.
For the GPU server benchmark use case, this makes it hard to get a sense of scaling losses, the performance price paid for adding another GPU. The goal with this tool is to get a sense of wholistic performance of the whole box.
In gpu_box_benchmark, single GPU tests are parallelized using Docker containers. The same test is invoked inside of a docker container, one per GPU. The containers are started at the same time so each GPU is loaded at the same time.
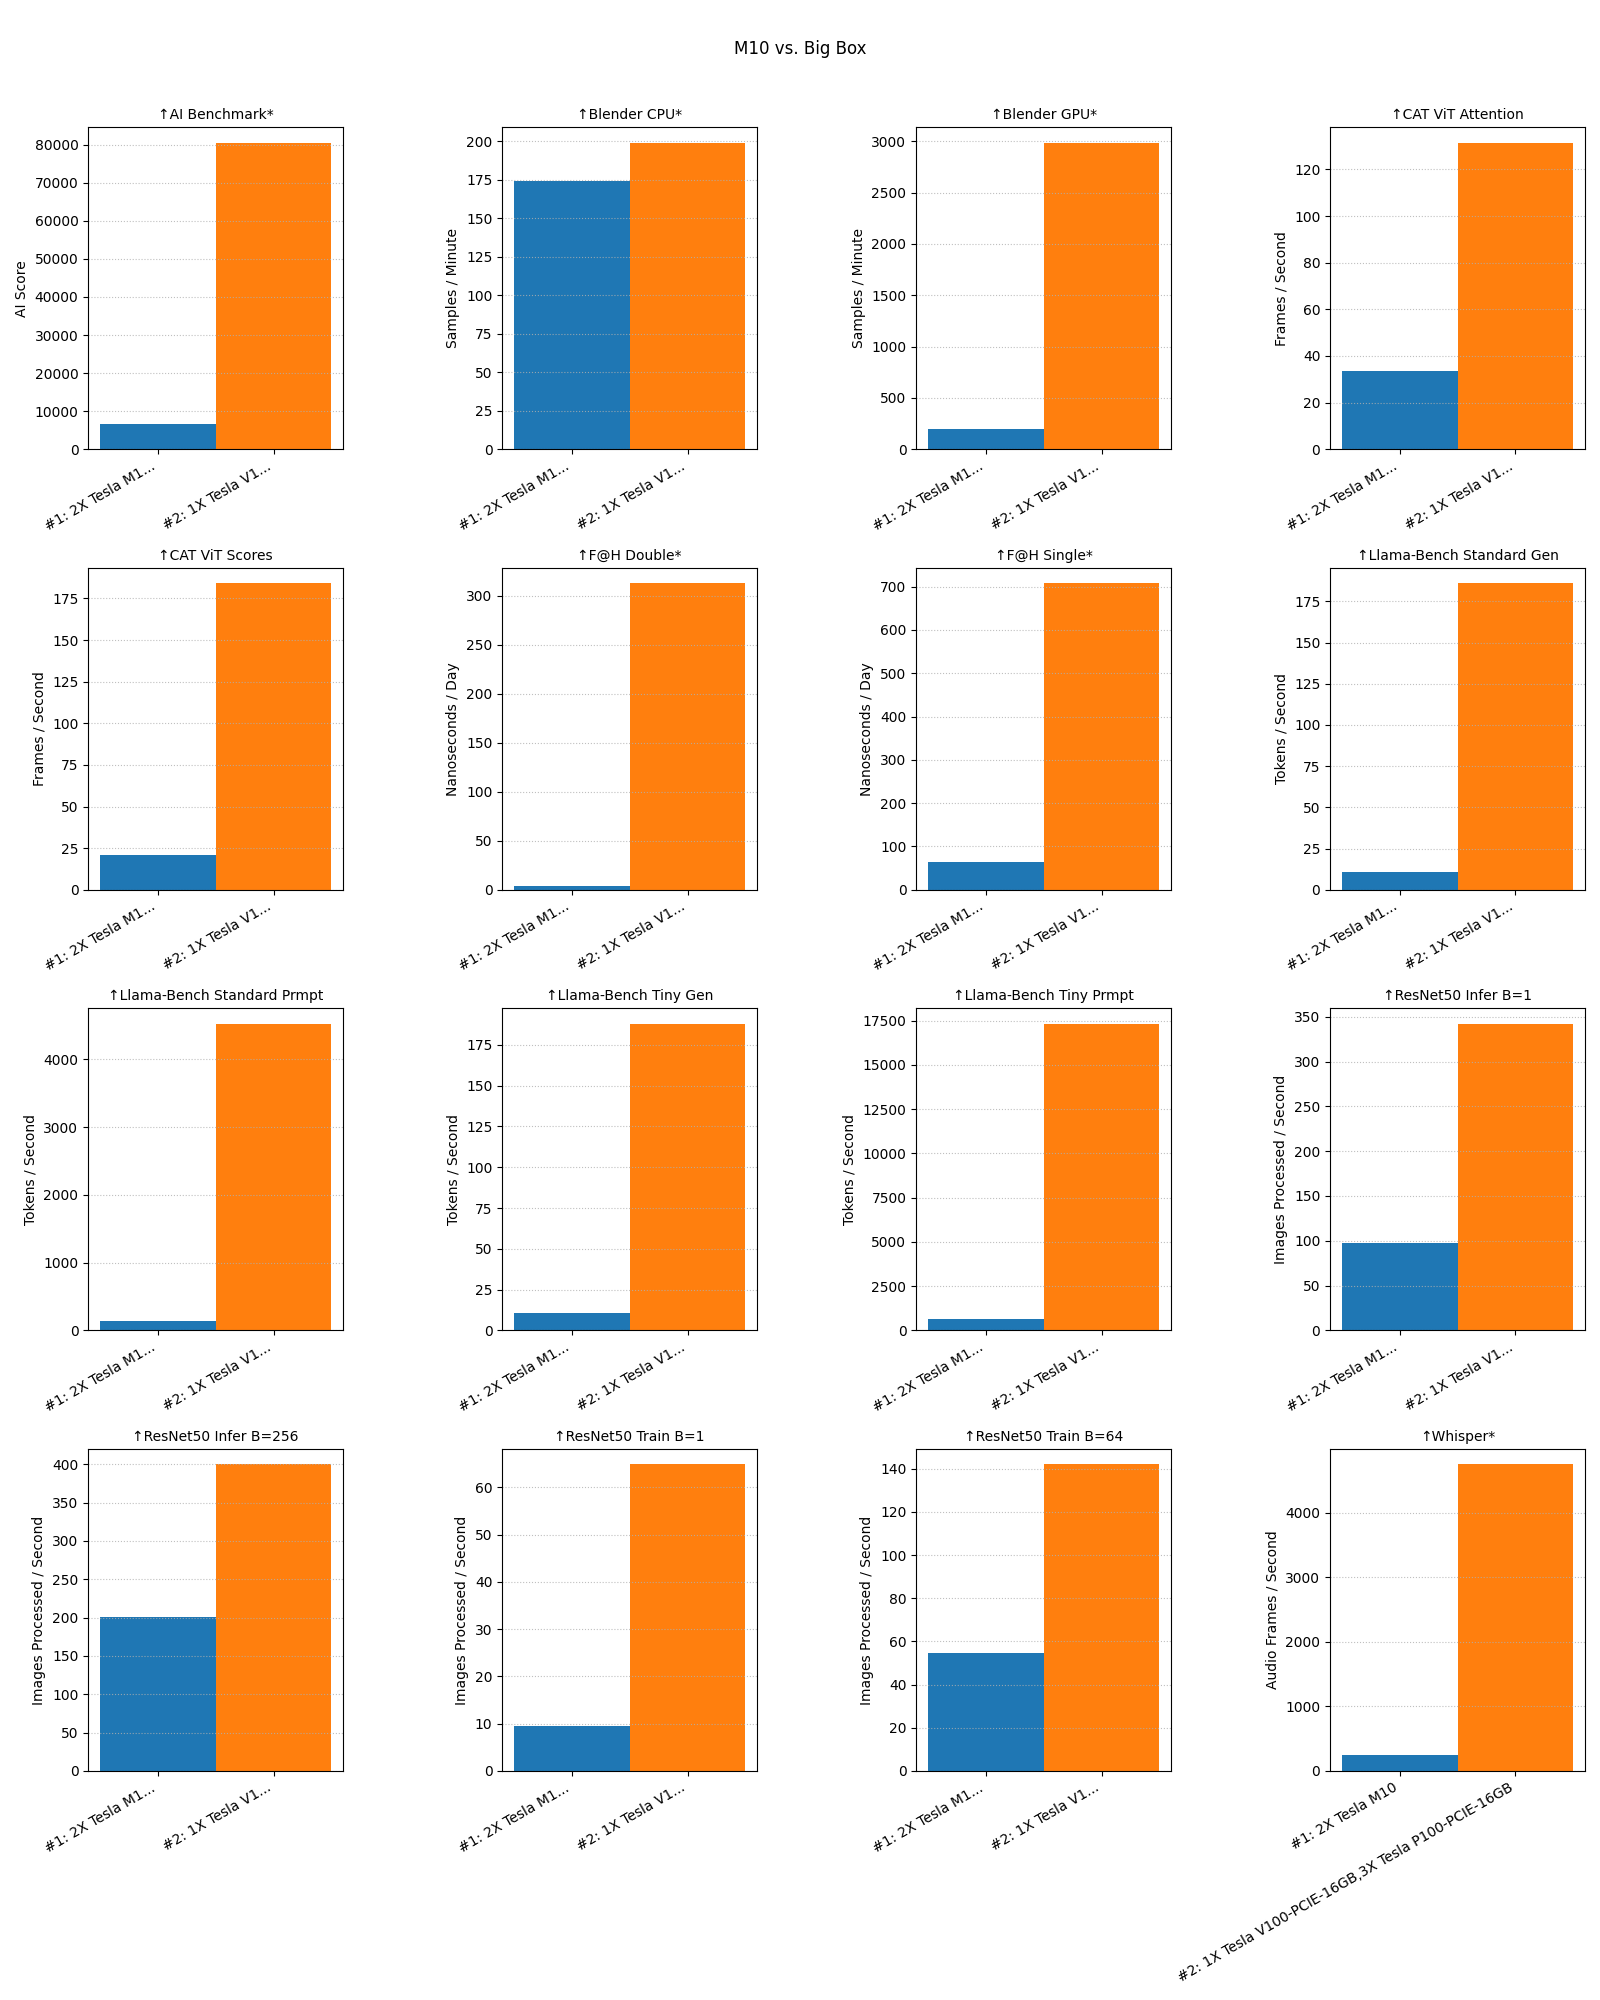
The tool has a JSON output and a comparison utility that can plot difference between multiple runs. Here’s a sample comparing a system with two cores of a Tesla M10 vs. my big GPU box that has 3x P100s and a V100:
Here’s the load profile and temperatures for the V100 during the first hour of the benchmark:
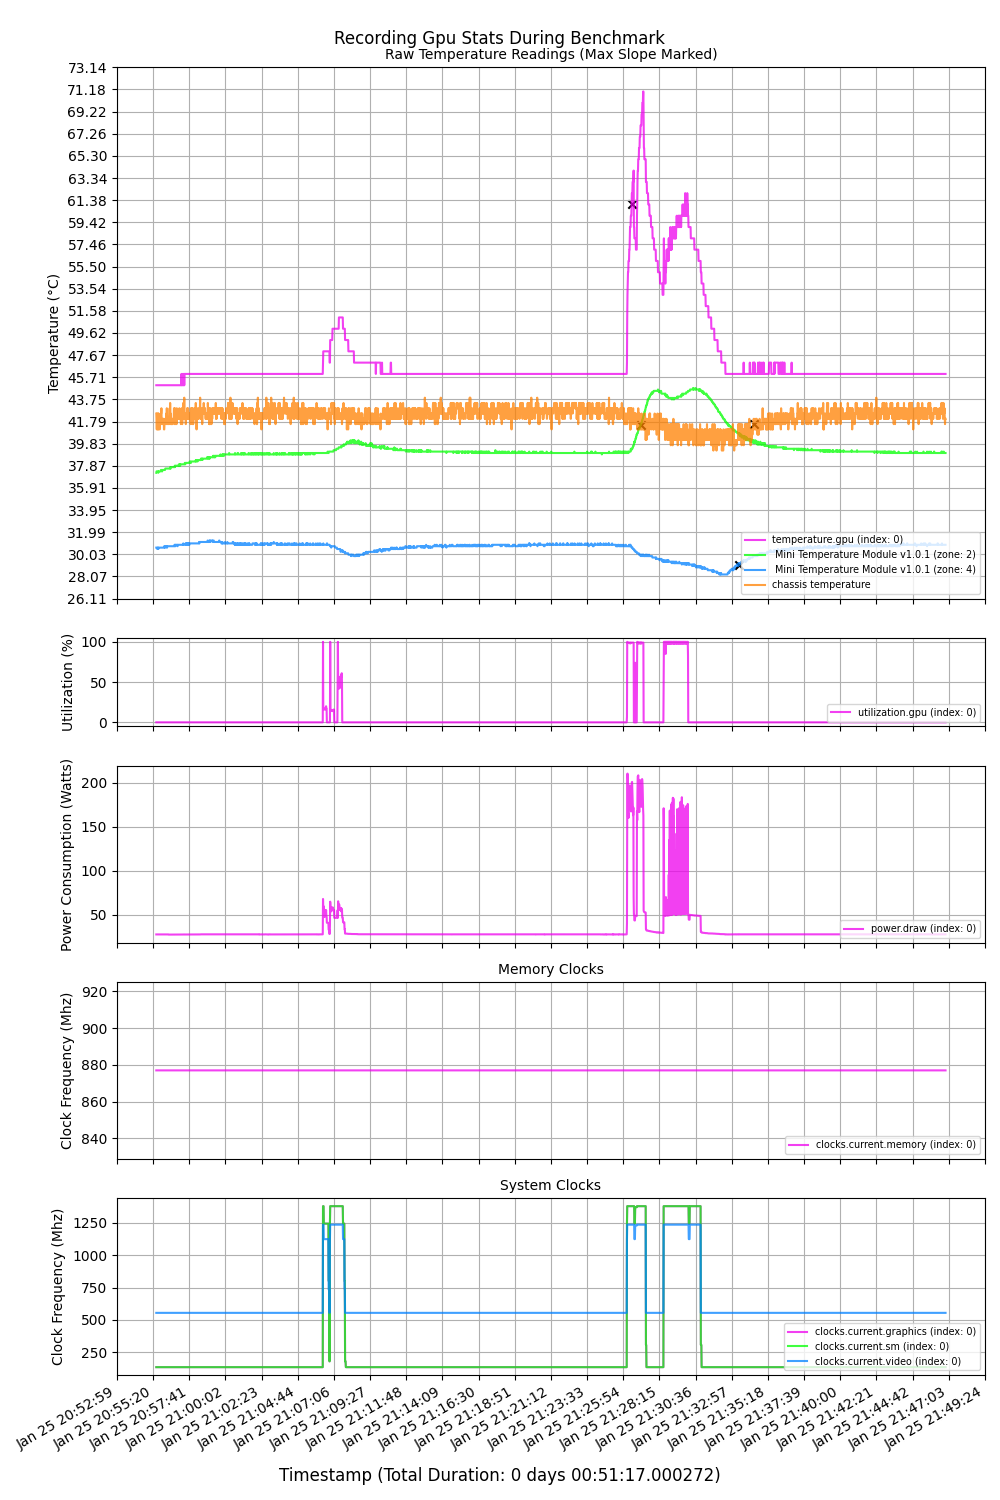
These visualizations have appeared a few times on the blog but I haven’t finished the tooling yet so it’s not available for wider use. The idea is to be able to compare measured external temperatures of the GPUs with the metrics reported by nvidia-smi. This lets us model the relationship to improve cooler performance.
Benchmark Tests
In terms of the tests themselves, the following is from the docs command in gpu_box_benchmark.
These are the set of tests I plan on running on all the builds. Remember, this tool is a GPU server benchmark so there is some testing of the CPU as well. I plan to also add disk access and memory bandwidth tests in the future.
ResNet50
From the NVidia Deep Learning Examples Repo, the ResNet50 benchmark uses the pytorch backend to run a workload on the GPU. The benchmark uses a synthetic data backend, so it isolates raw compute and framework performance without being limited by disk or data-loading I/O. t can be configured via environment variables to measure either training or inference performance, with optional automatic mixed precision (AMP) enabled to reflect modern GPU usage.
Llama-Bench
This benchmark uses the CUDA-enabled llama.cpp container to measure large language model inference performance on the GPU using the purpose-built llama-bench tool. The container downloads quantized GGUF models, ranging from a small 1.5B-parameter Qwen model to a standard 8B-parameter Llama 3 model, allowing performance testing across different VRAM and compute requirements.
Blender Benchmark
This benchmark uses Blender’s official Open Data benchmark suite to measure GPU rendering performance in a standardized, real-world workload. The workload exercises GPU compute, memory, and driver performance Overall, this benchmark evaluates how well a GPU performs on production-style 3D rendering tasks that closely reflect professional content-creation use cases. This is not an AI-related benchmark.
FAHbench
This benchmark builds and runs FAHBench, the Folding@home microbenchmark suite, to evaluate GPU compute performance using OpenCL. The container compiles FAHBench from source with the GUI disabled, ensuring a headless, reproducible setup suitable for automated benchmarking The workload stresses floating-point throughput, memory access patterns, and driver stability in a scientific computing context rather than graphics or deep learning. Overall, this benchmark measures how well a GPU performs on sustained, real-world molecular dynamics–style calculations similar to Folding@home workloads.
AI-Benchmark
This benchmark runs the AI Benchmark suite to evaluate end-to-end deep learning performance on the GPU using TensorFlow. Overall, it produces a single composite AI score that provides a high-level comparison of how well a GPU performs across common deep learning tasks.
Whisper
This benchmark measures GPU-accelerated speech-to-text performance using OpenAI’s Whisper “medium” model running on PyTorch with CUDA. At runtime, a fixed audio sample is transcribed on the GPU, ensuring consistent input across benchmark runs. The script measures only the transcription phase and reports throughput as mel-spectrogram frames processed per second. Overall, this test evaluates real-world GPU inference performance for transformer-based audio models rather than synthetic or microbenchmark workloads.
Content-Aware Timelapse Benchmark
Uses benchmark mode in content aware timelapse to measure throughput of a GPU or multipleGPUs through a ViT model. Has both a fused (score) and slower unused (attention) modes. This series of benchmarks is very relevant to the author if this repo as it is why the development is happening in the first place.
Content-Aware Timelapse
Image processing is important to me because of another project I recently published called Content-Aware Timelapse. If you’re still following me on twitter, you’ve likely seen some of the timelapses I’ve posted in the last year.
Originally I was using ffmpeg to drop frames to speed things up. Building things on camera inevitably means having to look for parts off camera. This leads to long, unmoving static shots.
One could and trim the bulk of the video out of these sections and re-timelapse but I wanted a more automated approach. The thinking went, if we’re speeding up the video by dropping frames, I wonder if we could use AI to analyze the frames to drop the boring ones. It turns out you can.
Now that our once 16:9 world is rapidly inverting to 9:16, the next question was could you use the same process to crop to the most interesting region of the video as well? Also yes.
The process is pretty computationally expensive. Even though my pipeline can hit 300 f/s of throughput, on a 10 hour video things still take a while. Should we all commit to adding GPU nodes to our homelabs to host LLMs, having alternate uses is important. To me Content-Aware Timelapse is a good supplemental use case.
I have been developing Content-Aware Timelapse as a multi GPU native application. It should run images through every GPU exposed to it. In this way it is also a great GPU server benchmark.
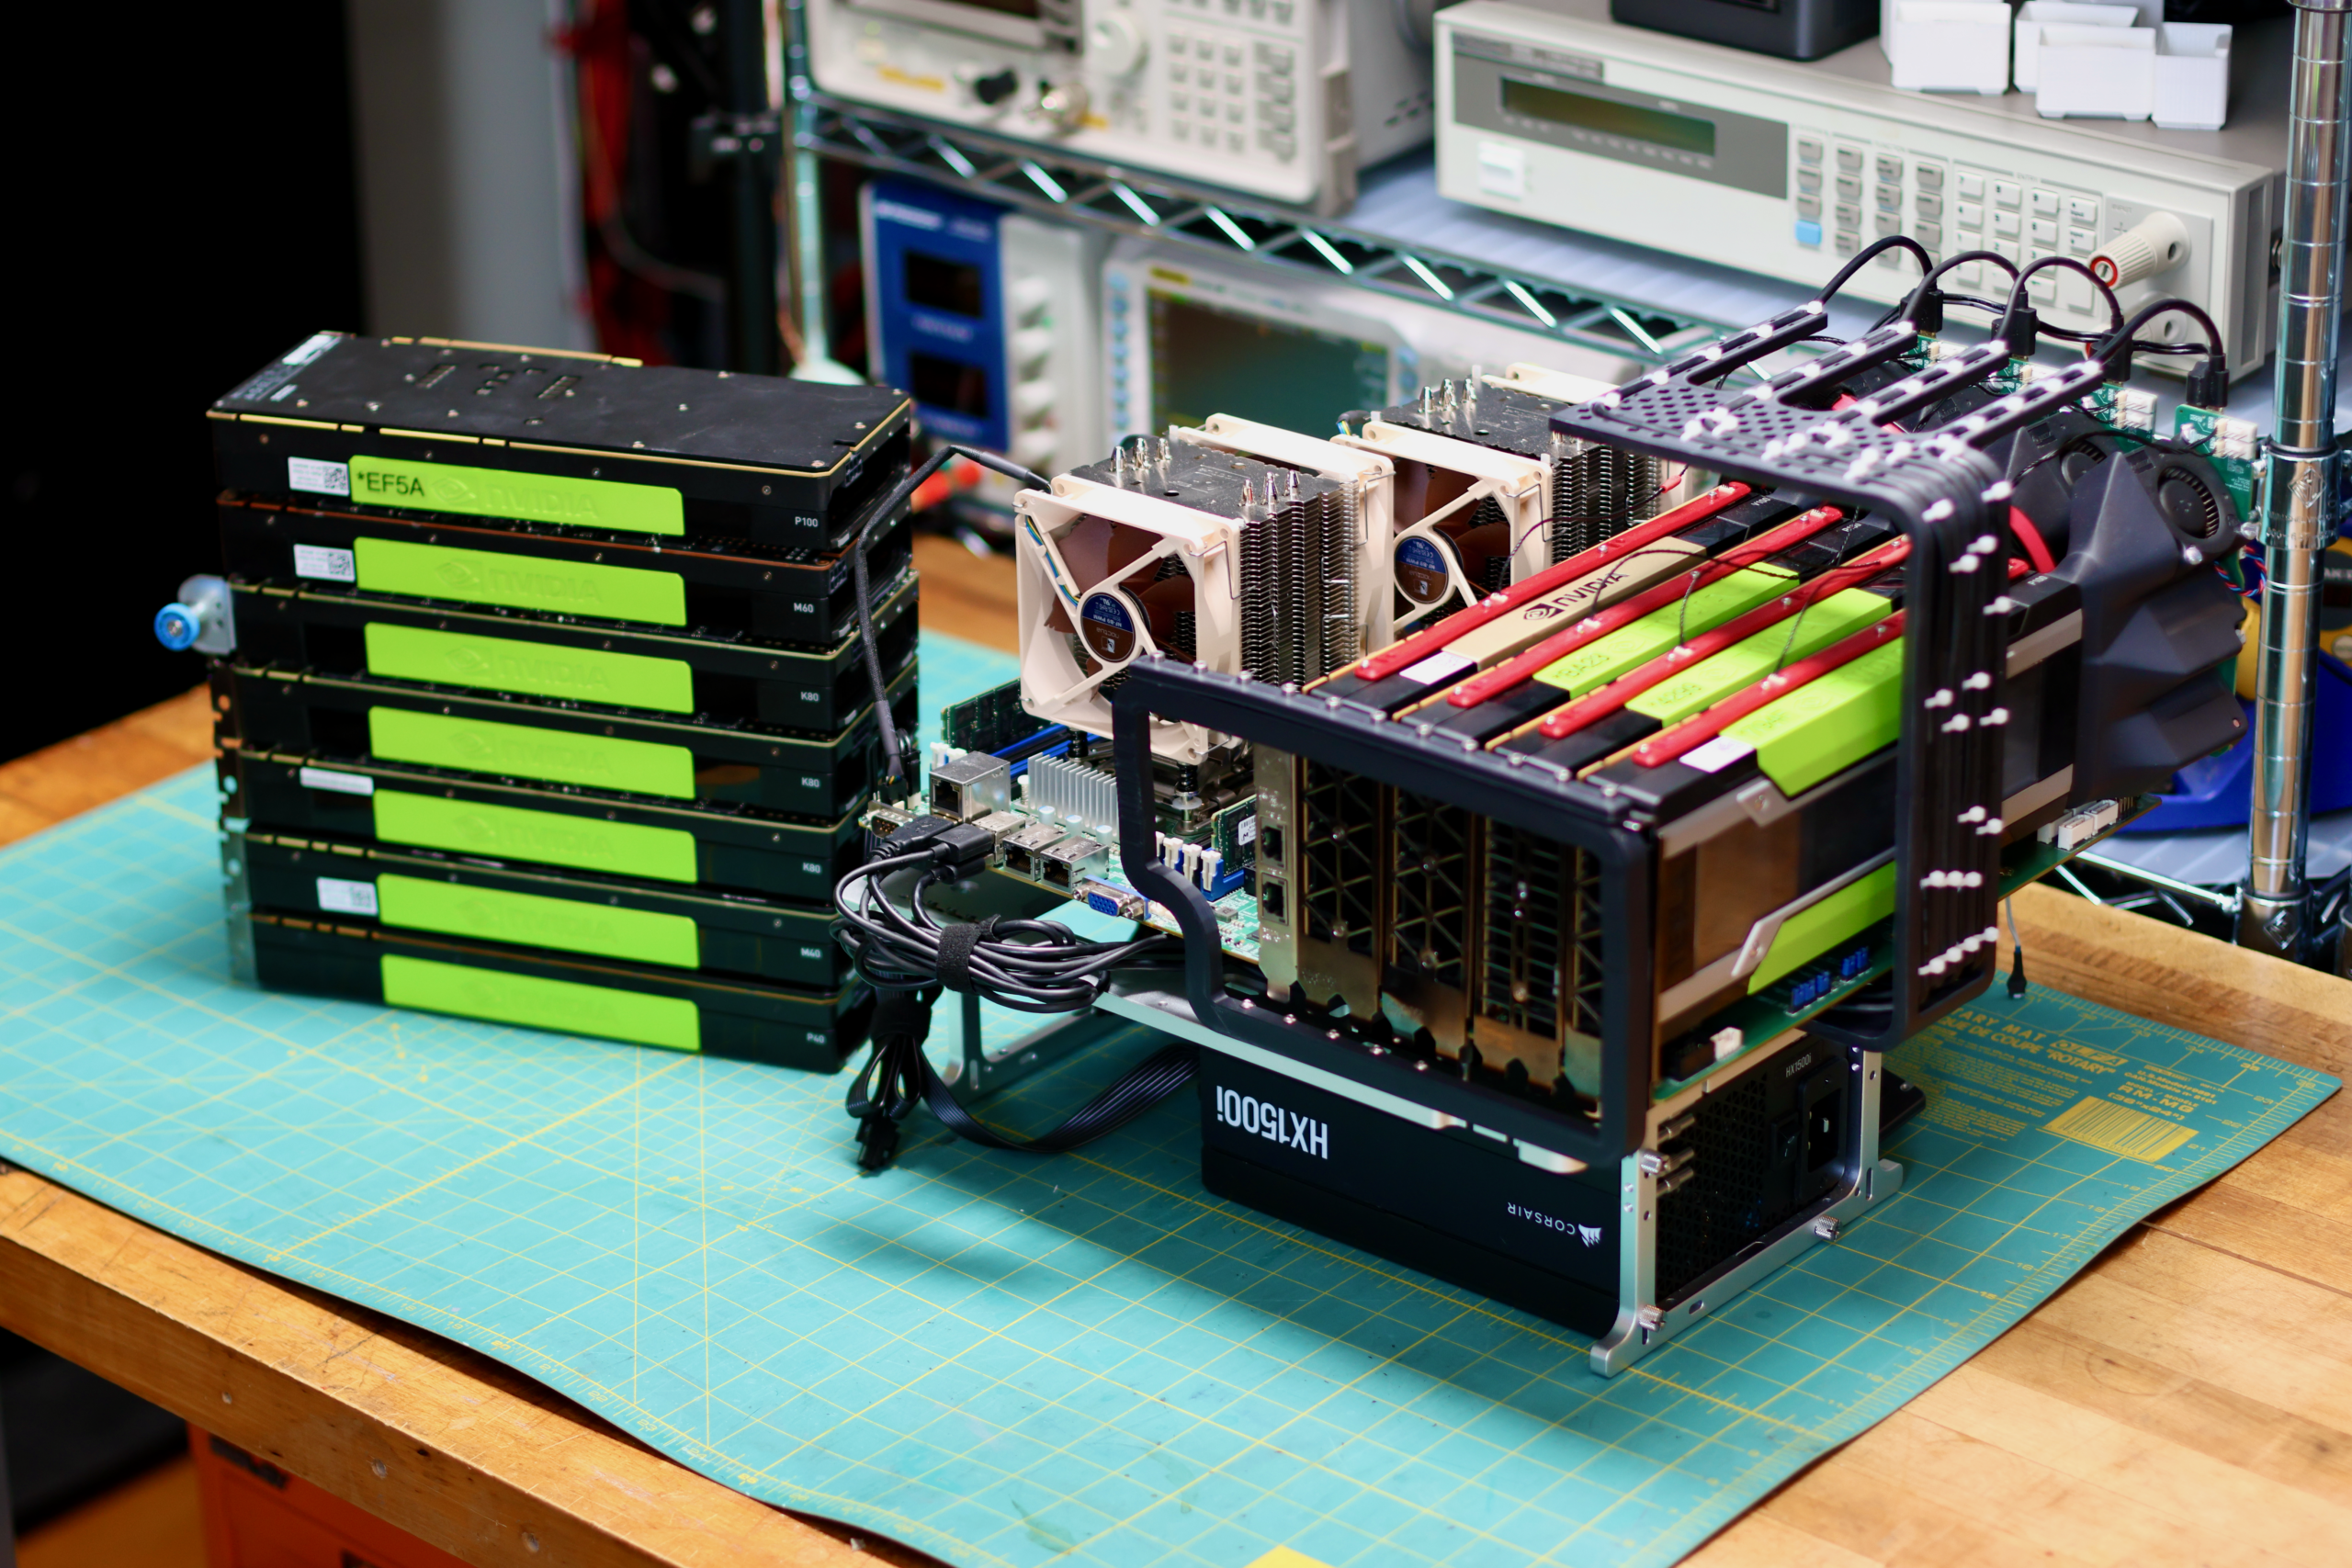
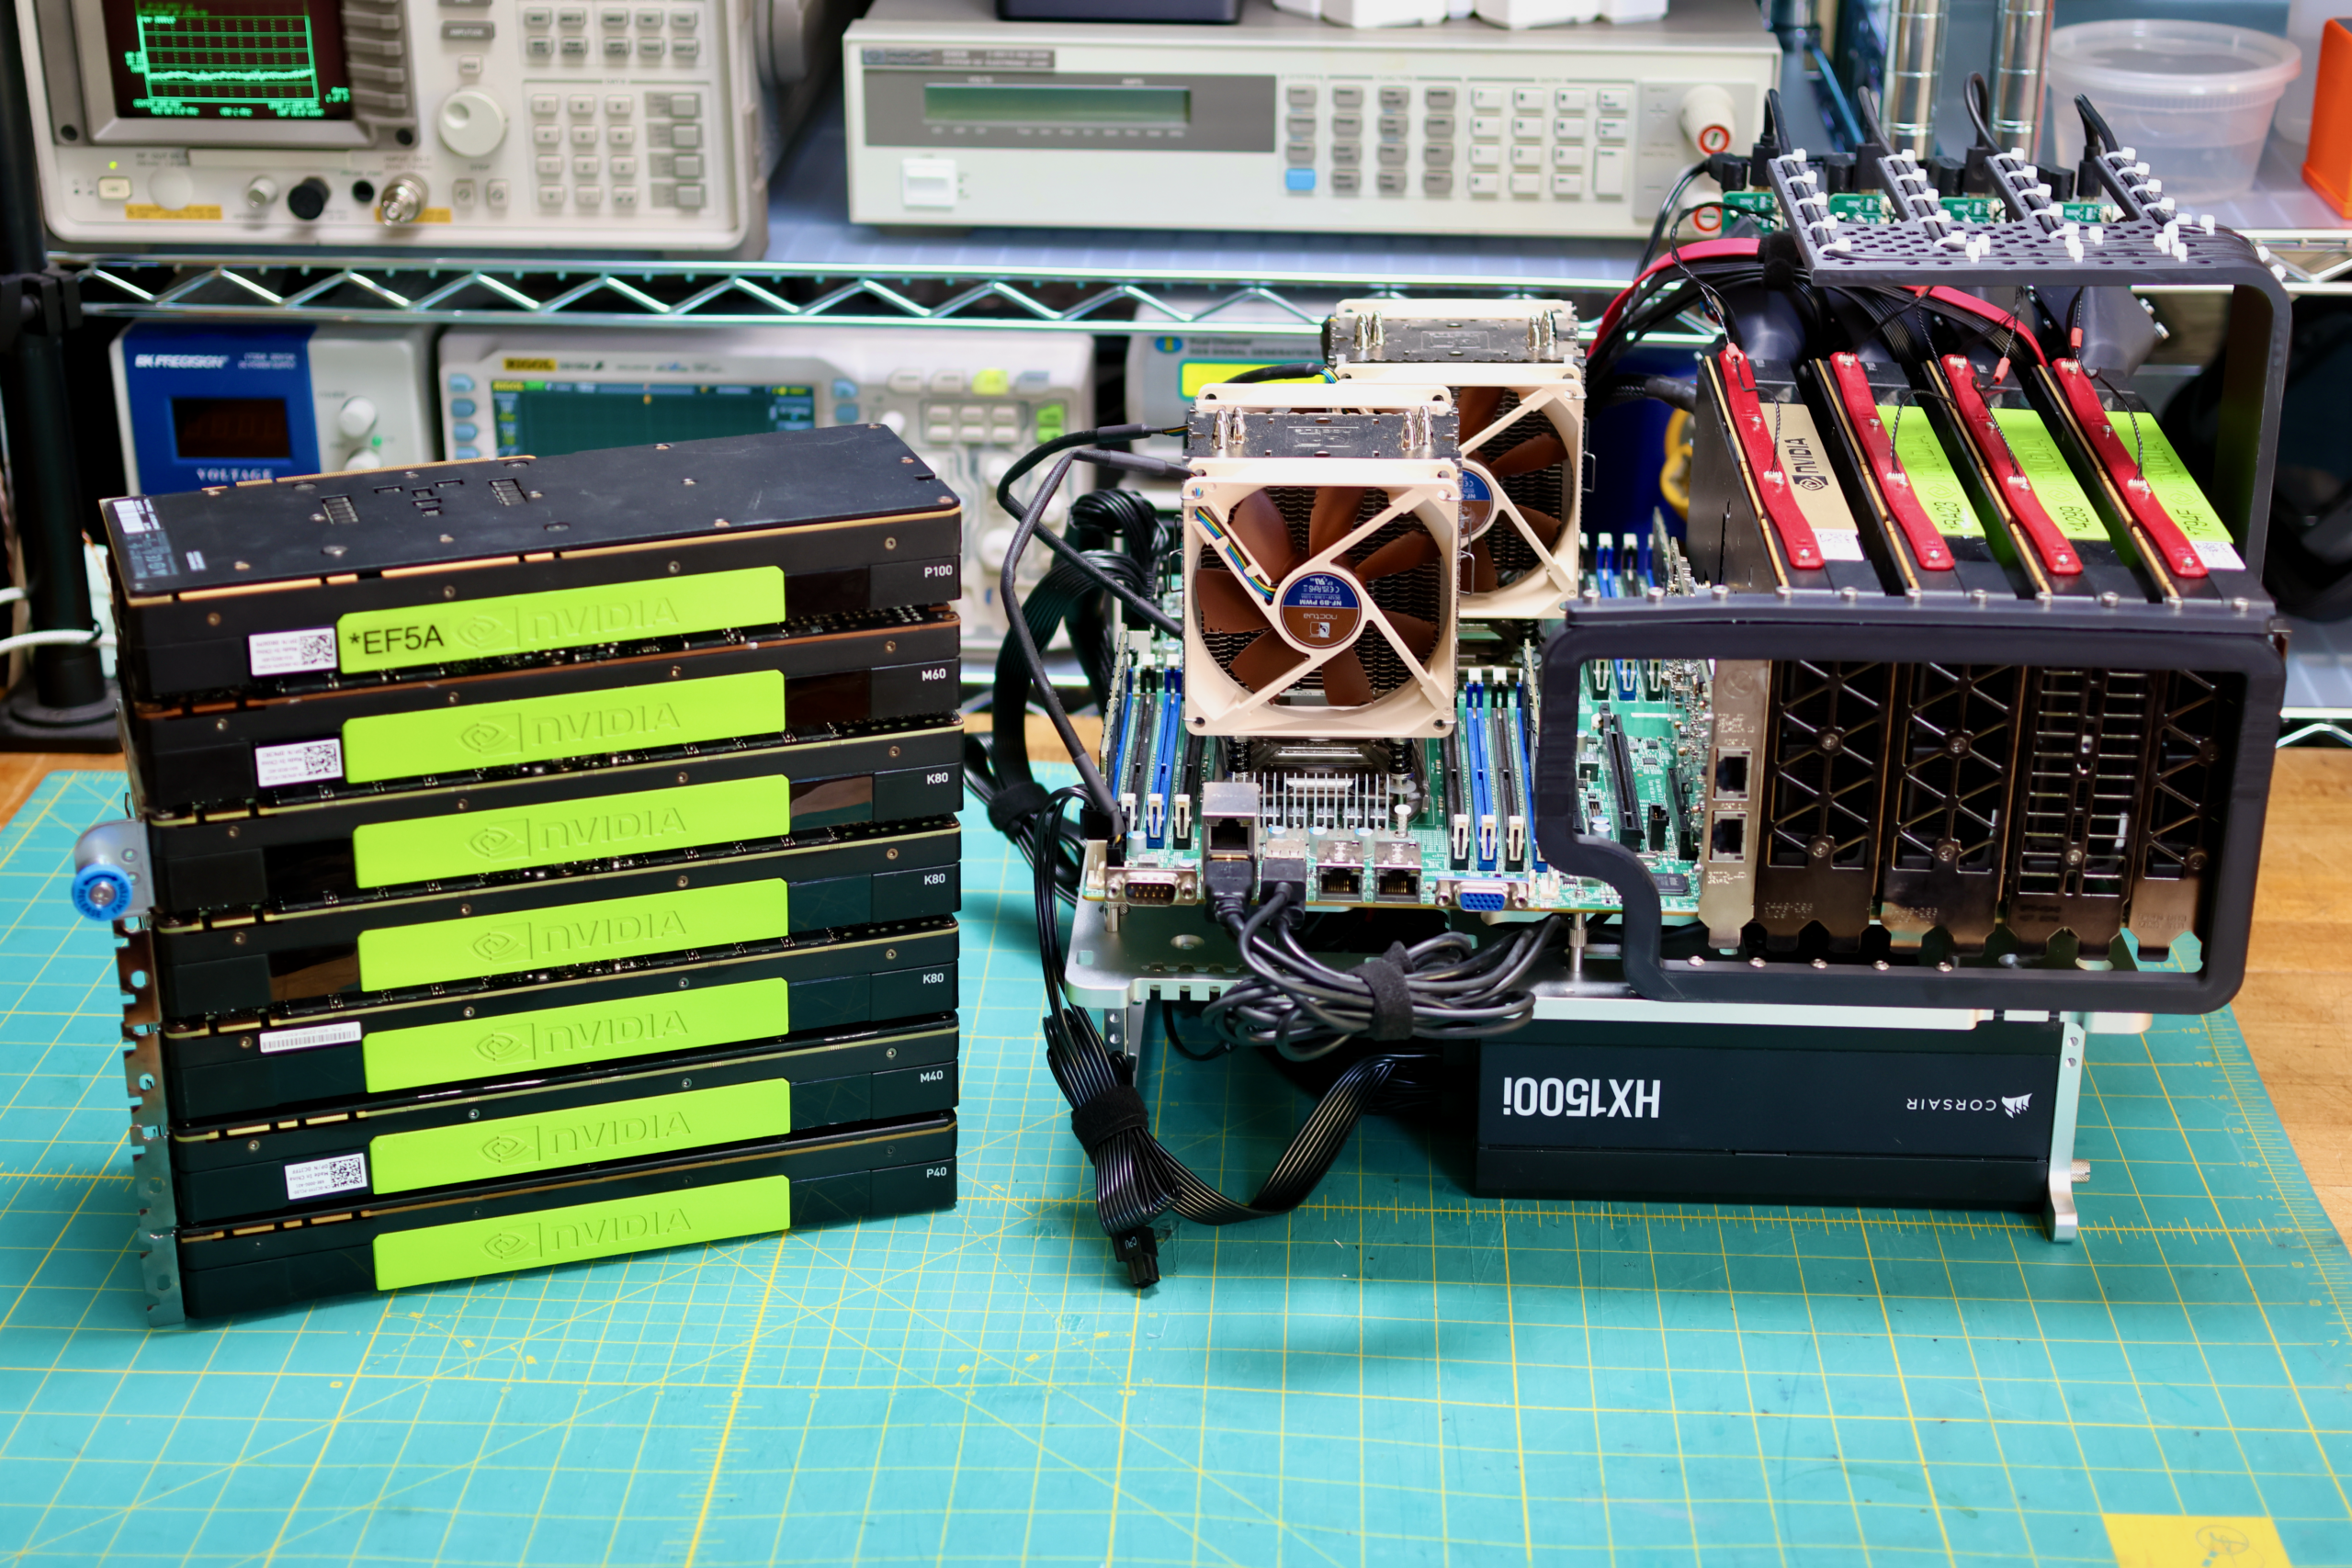
Hardware Updates
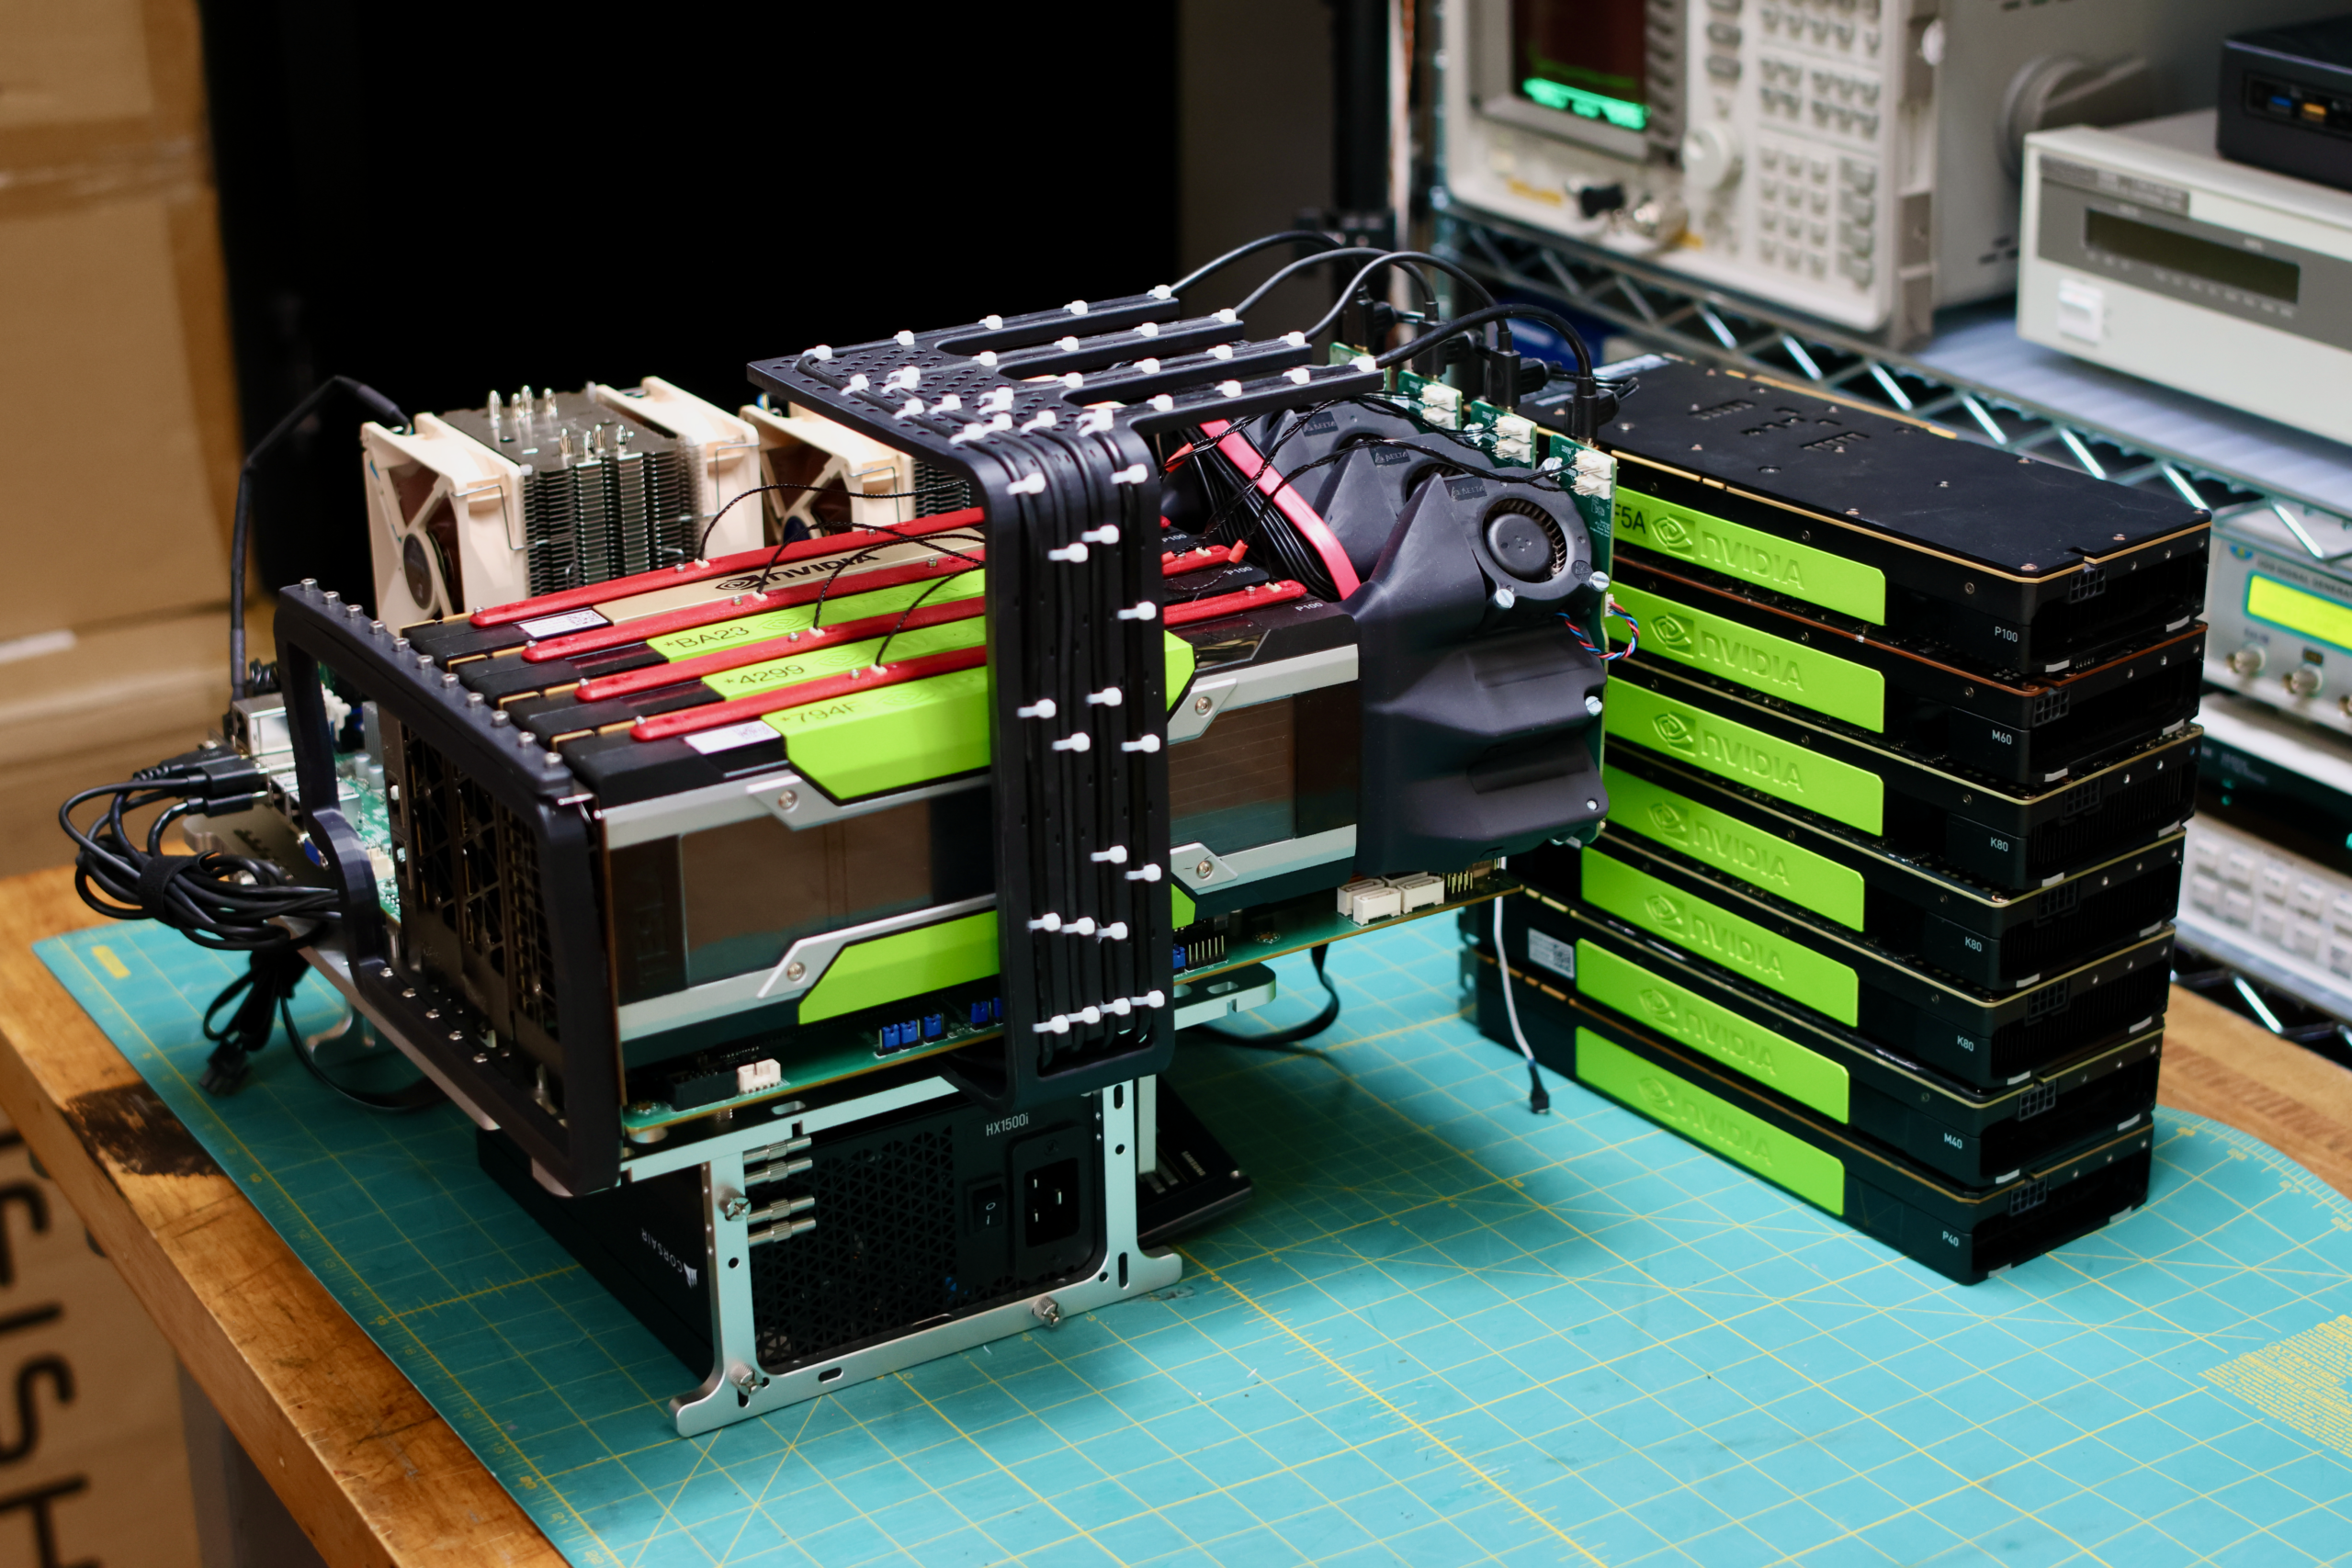
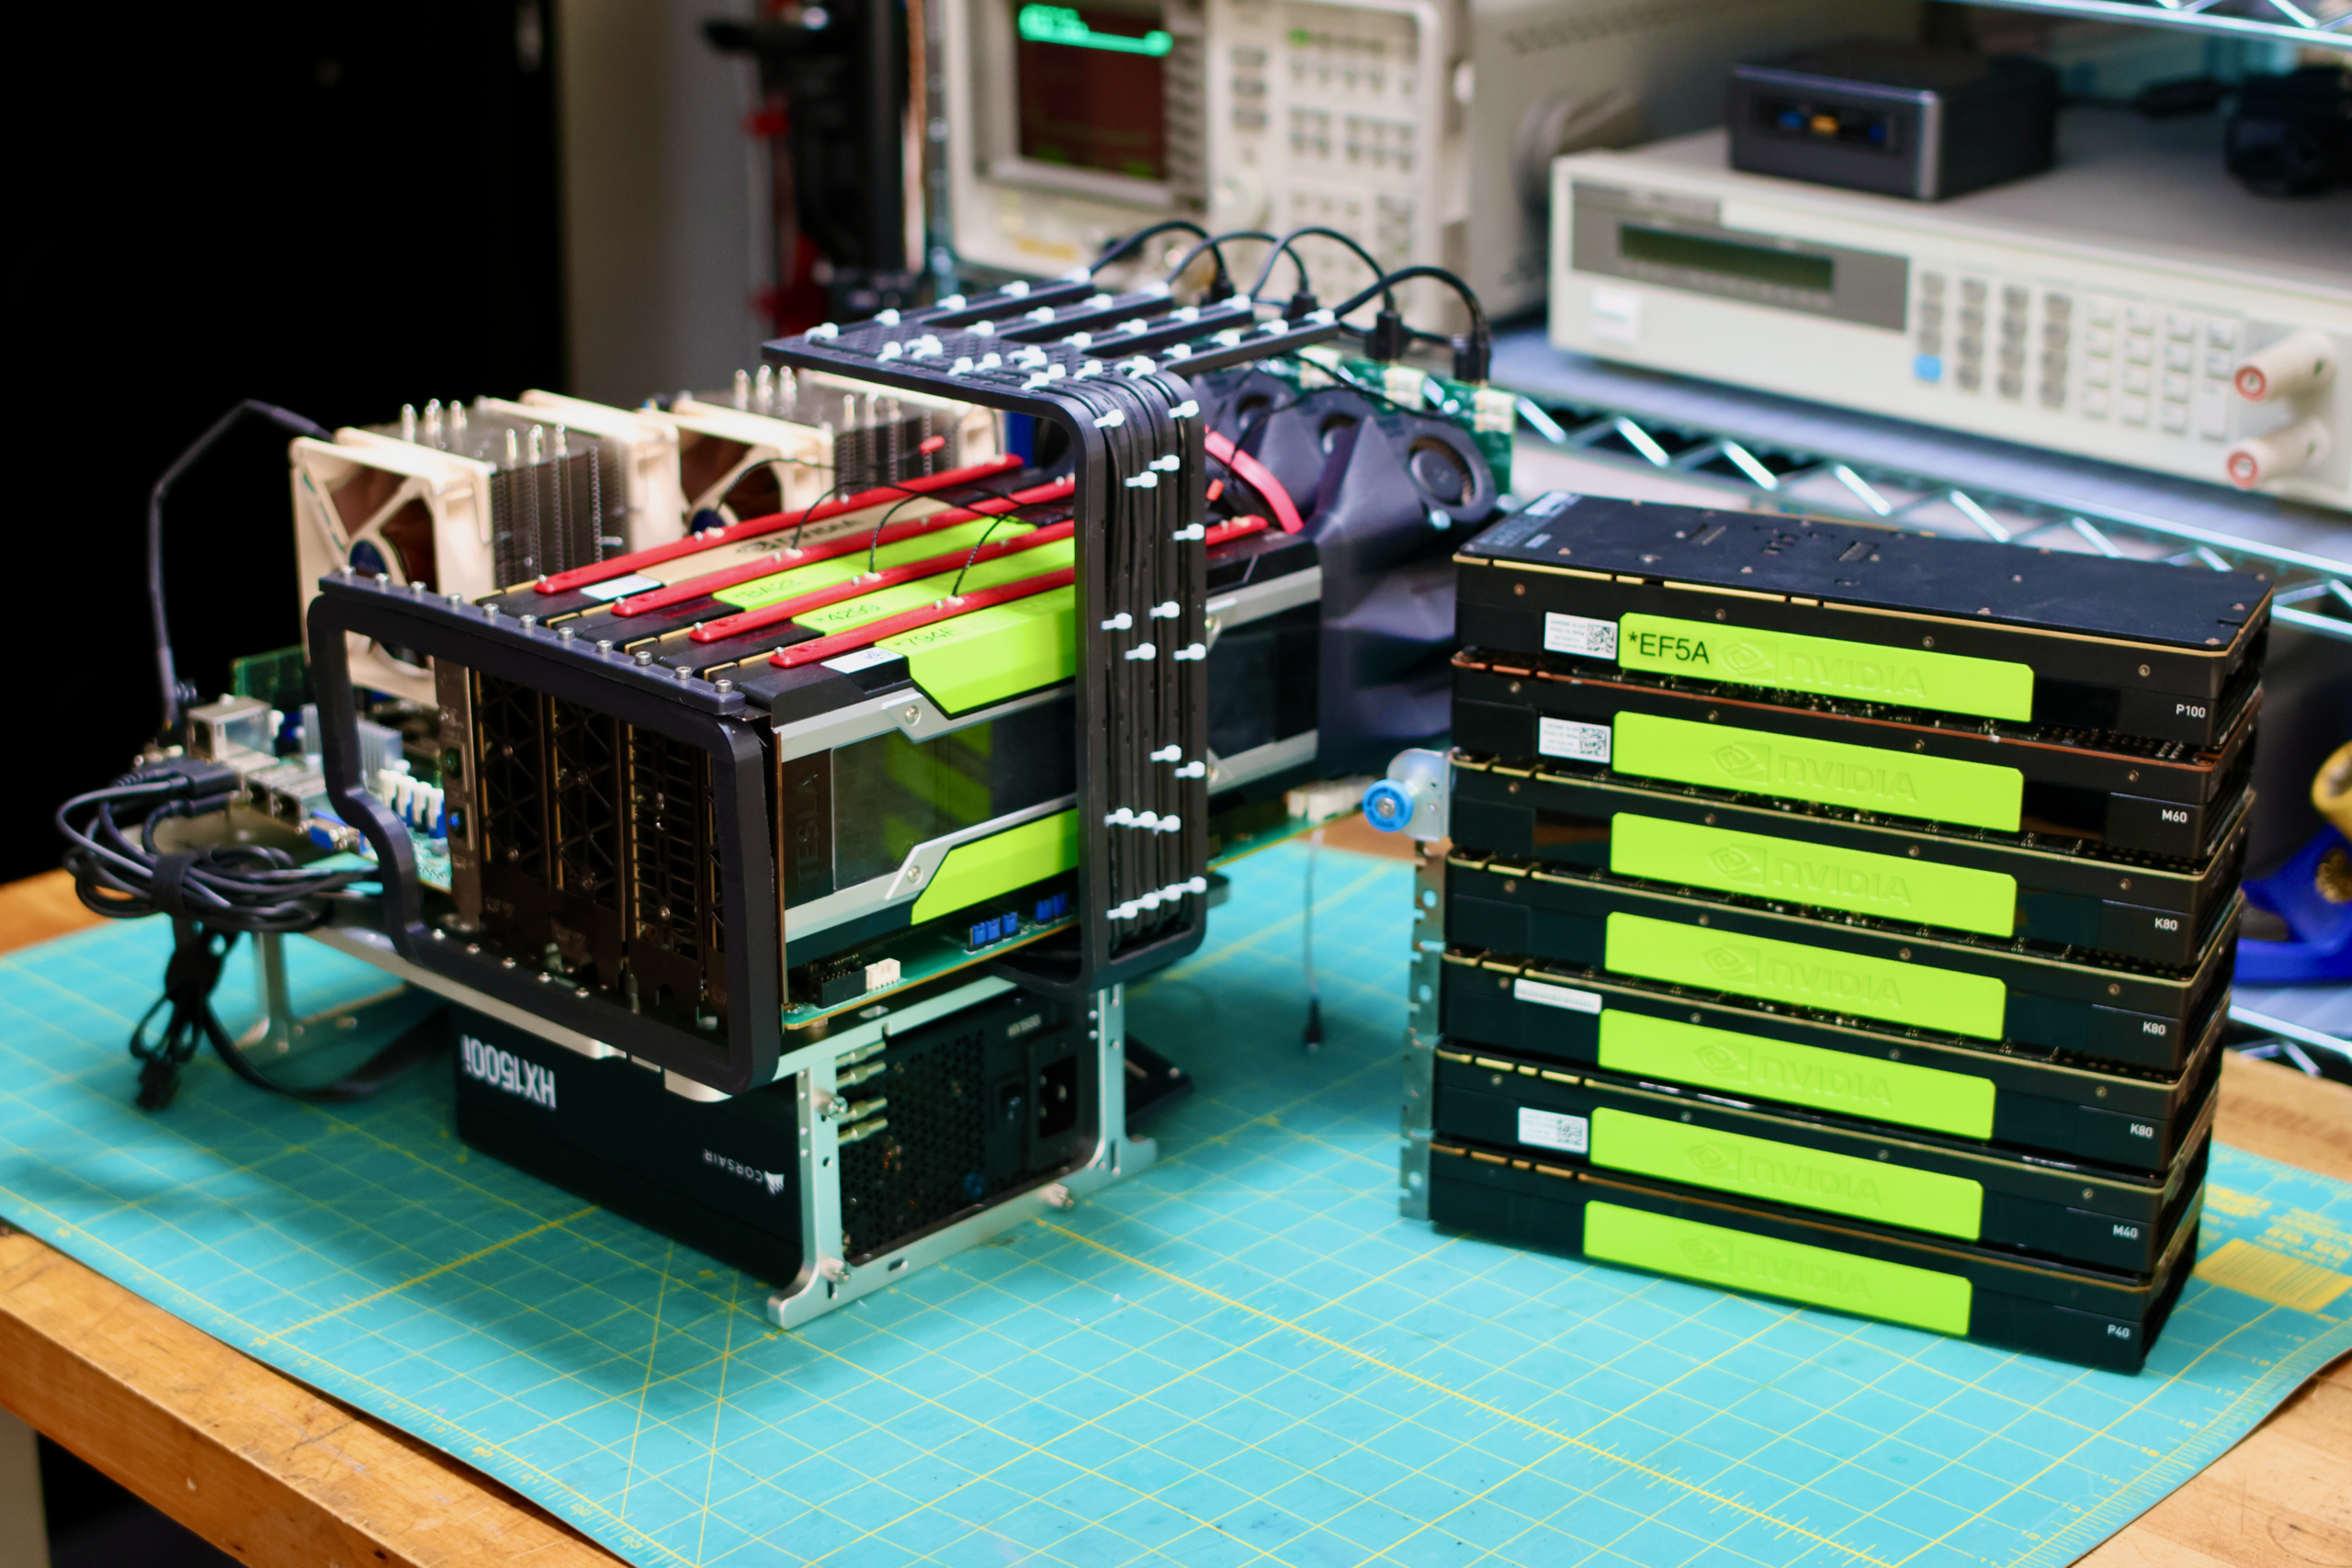
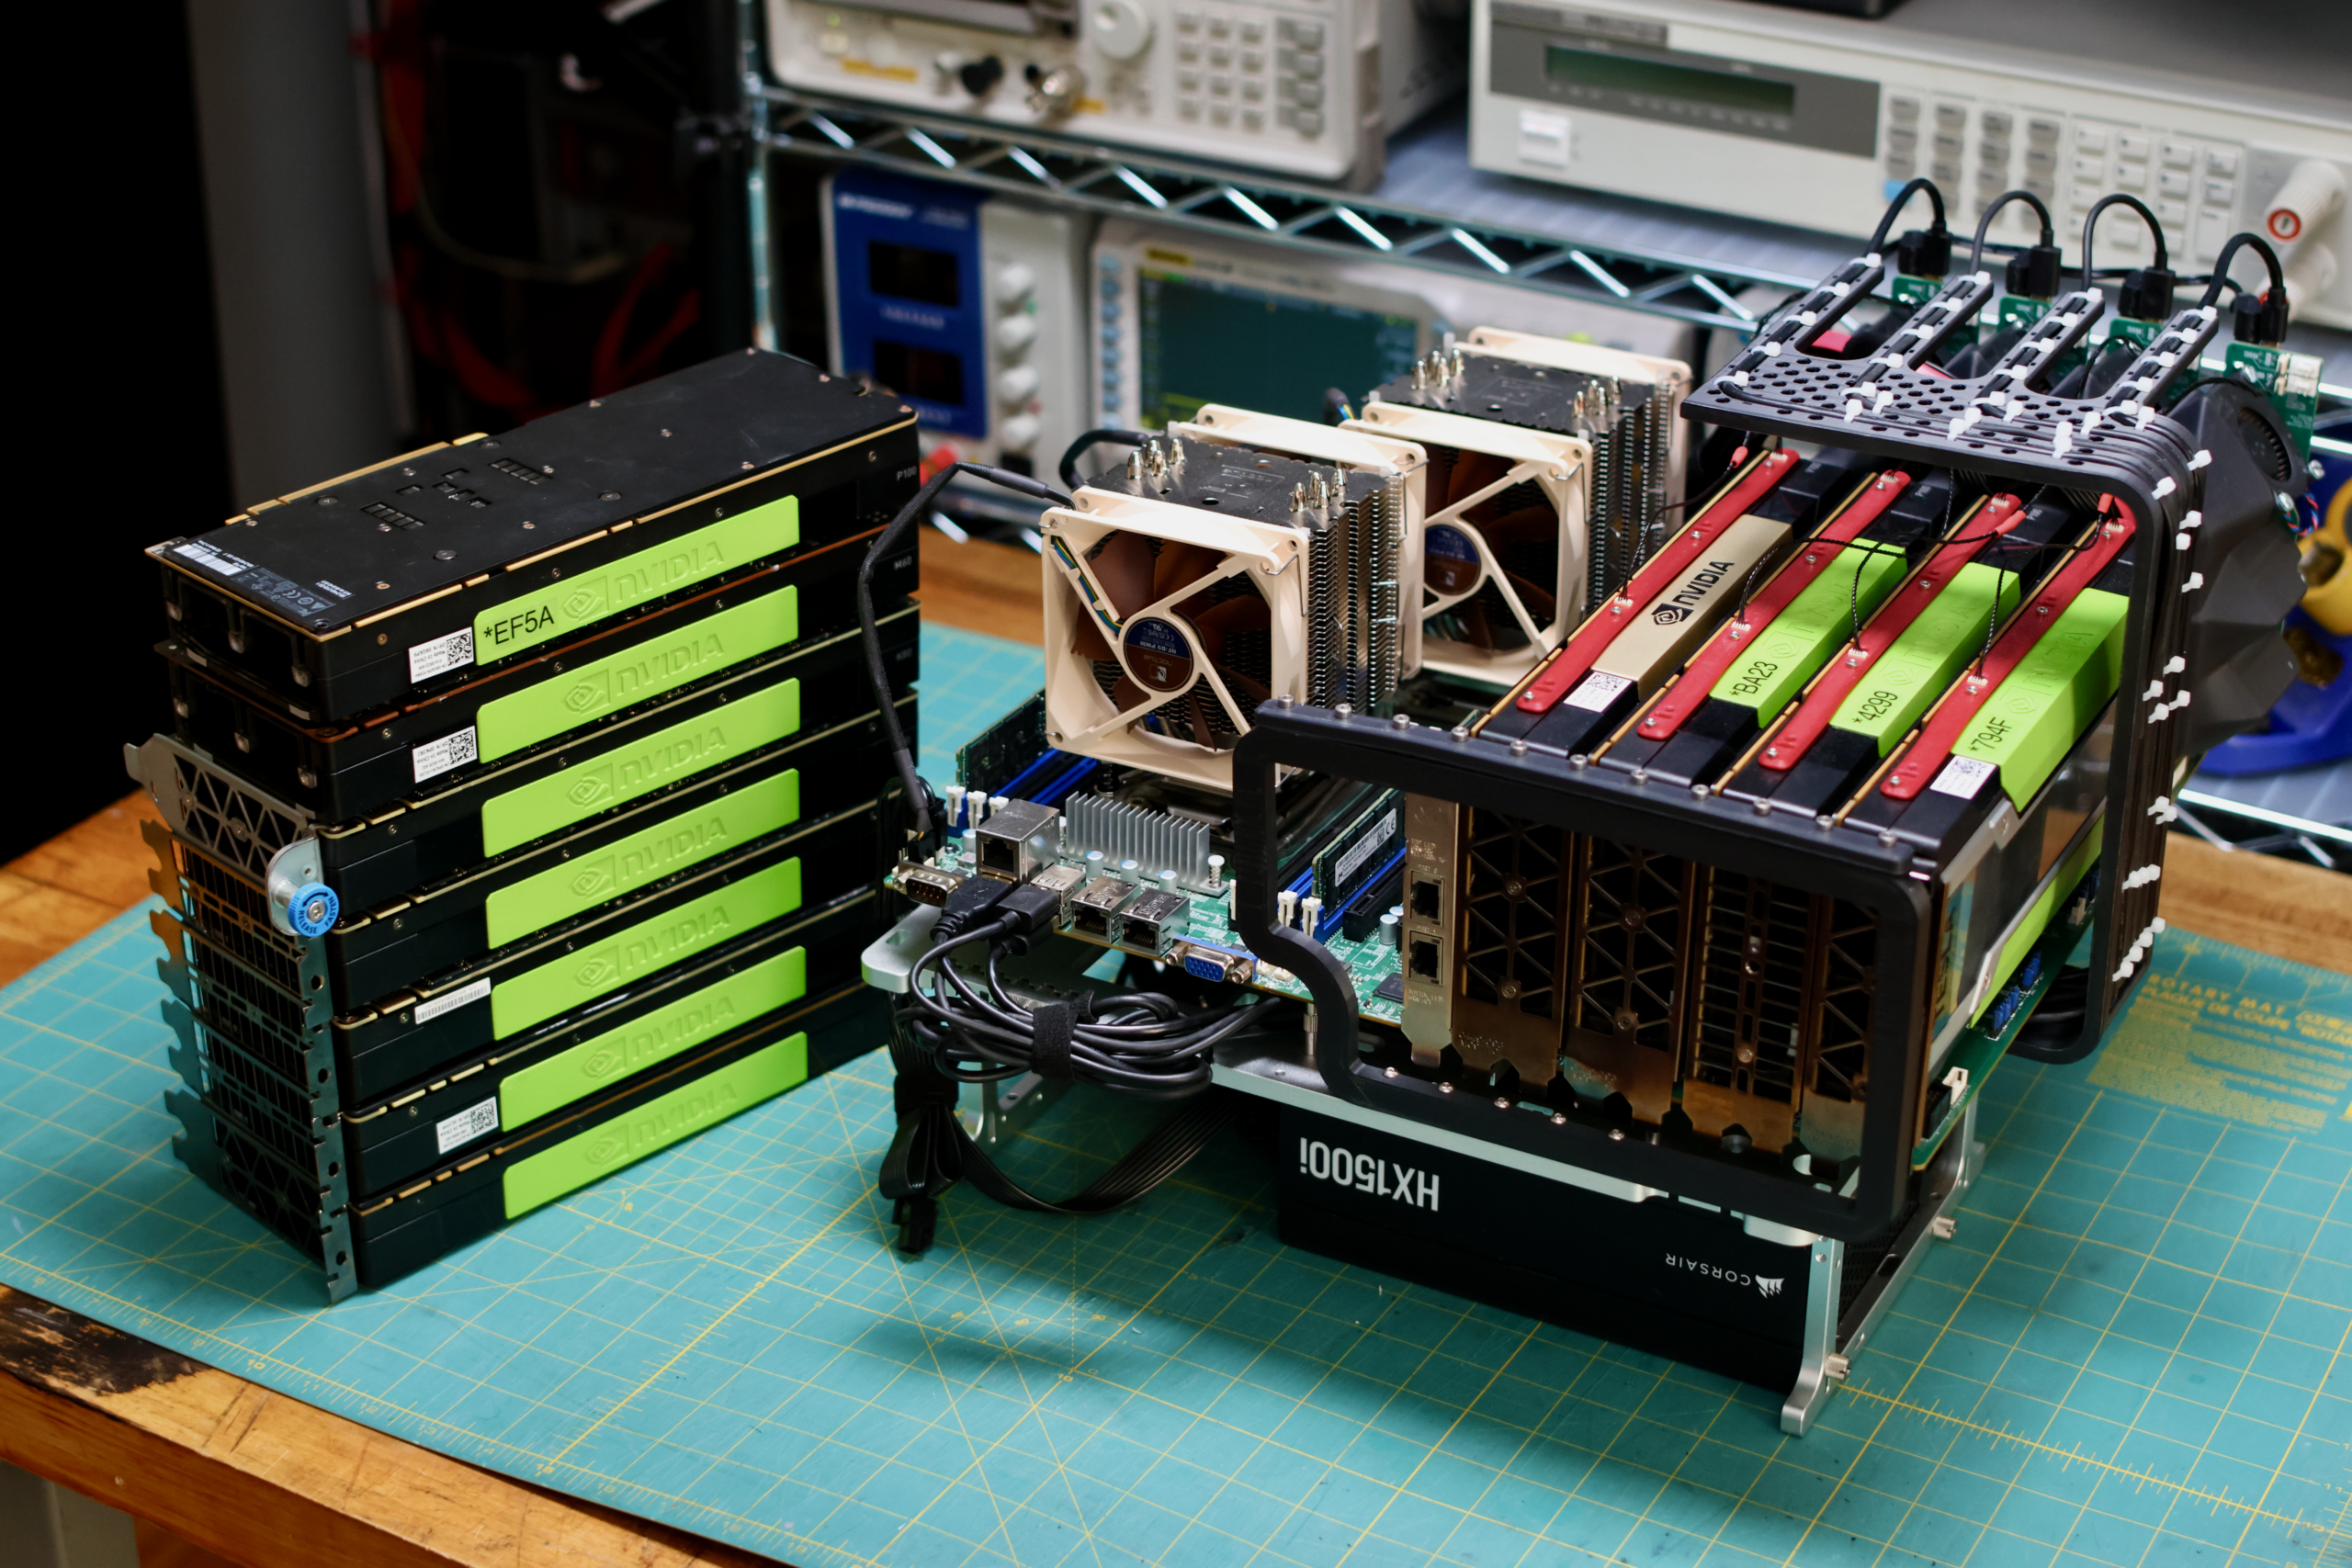
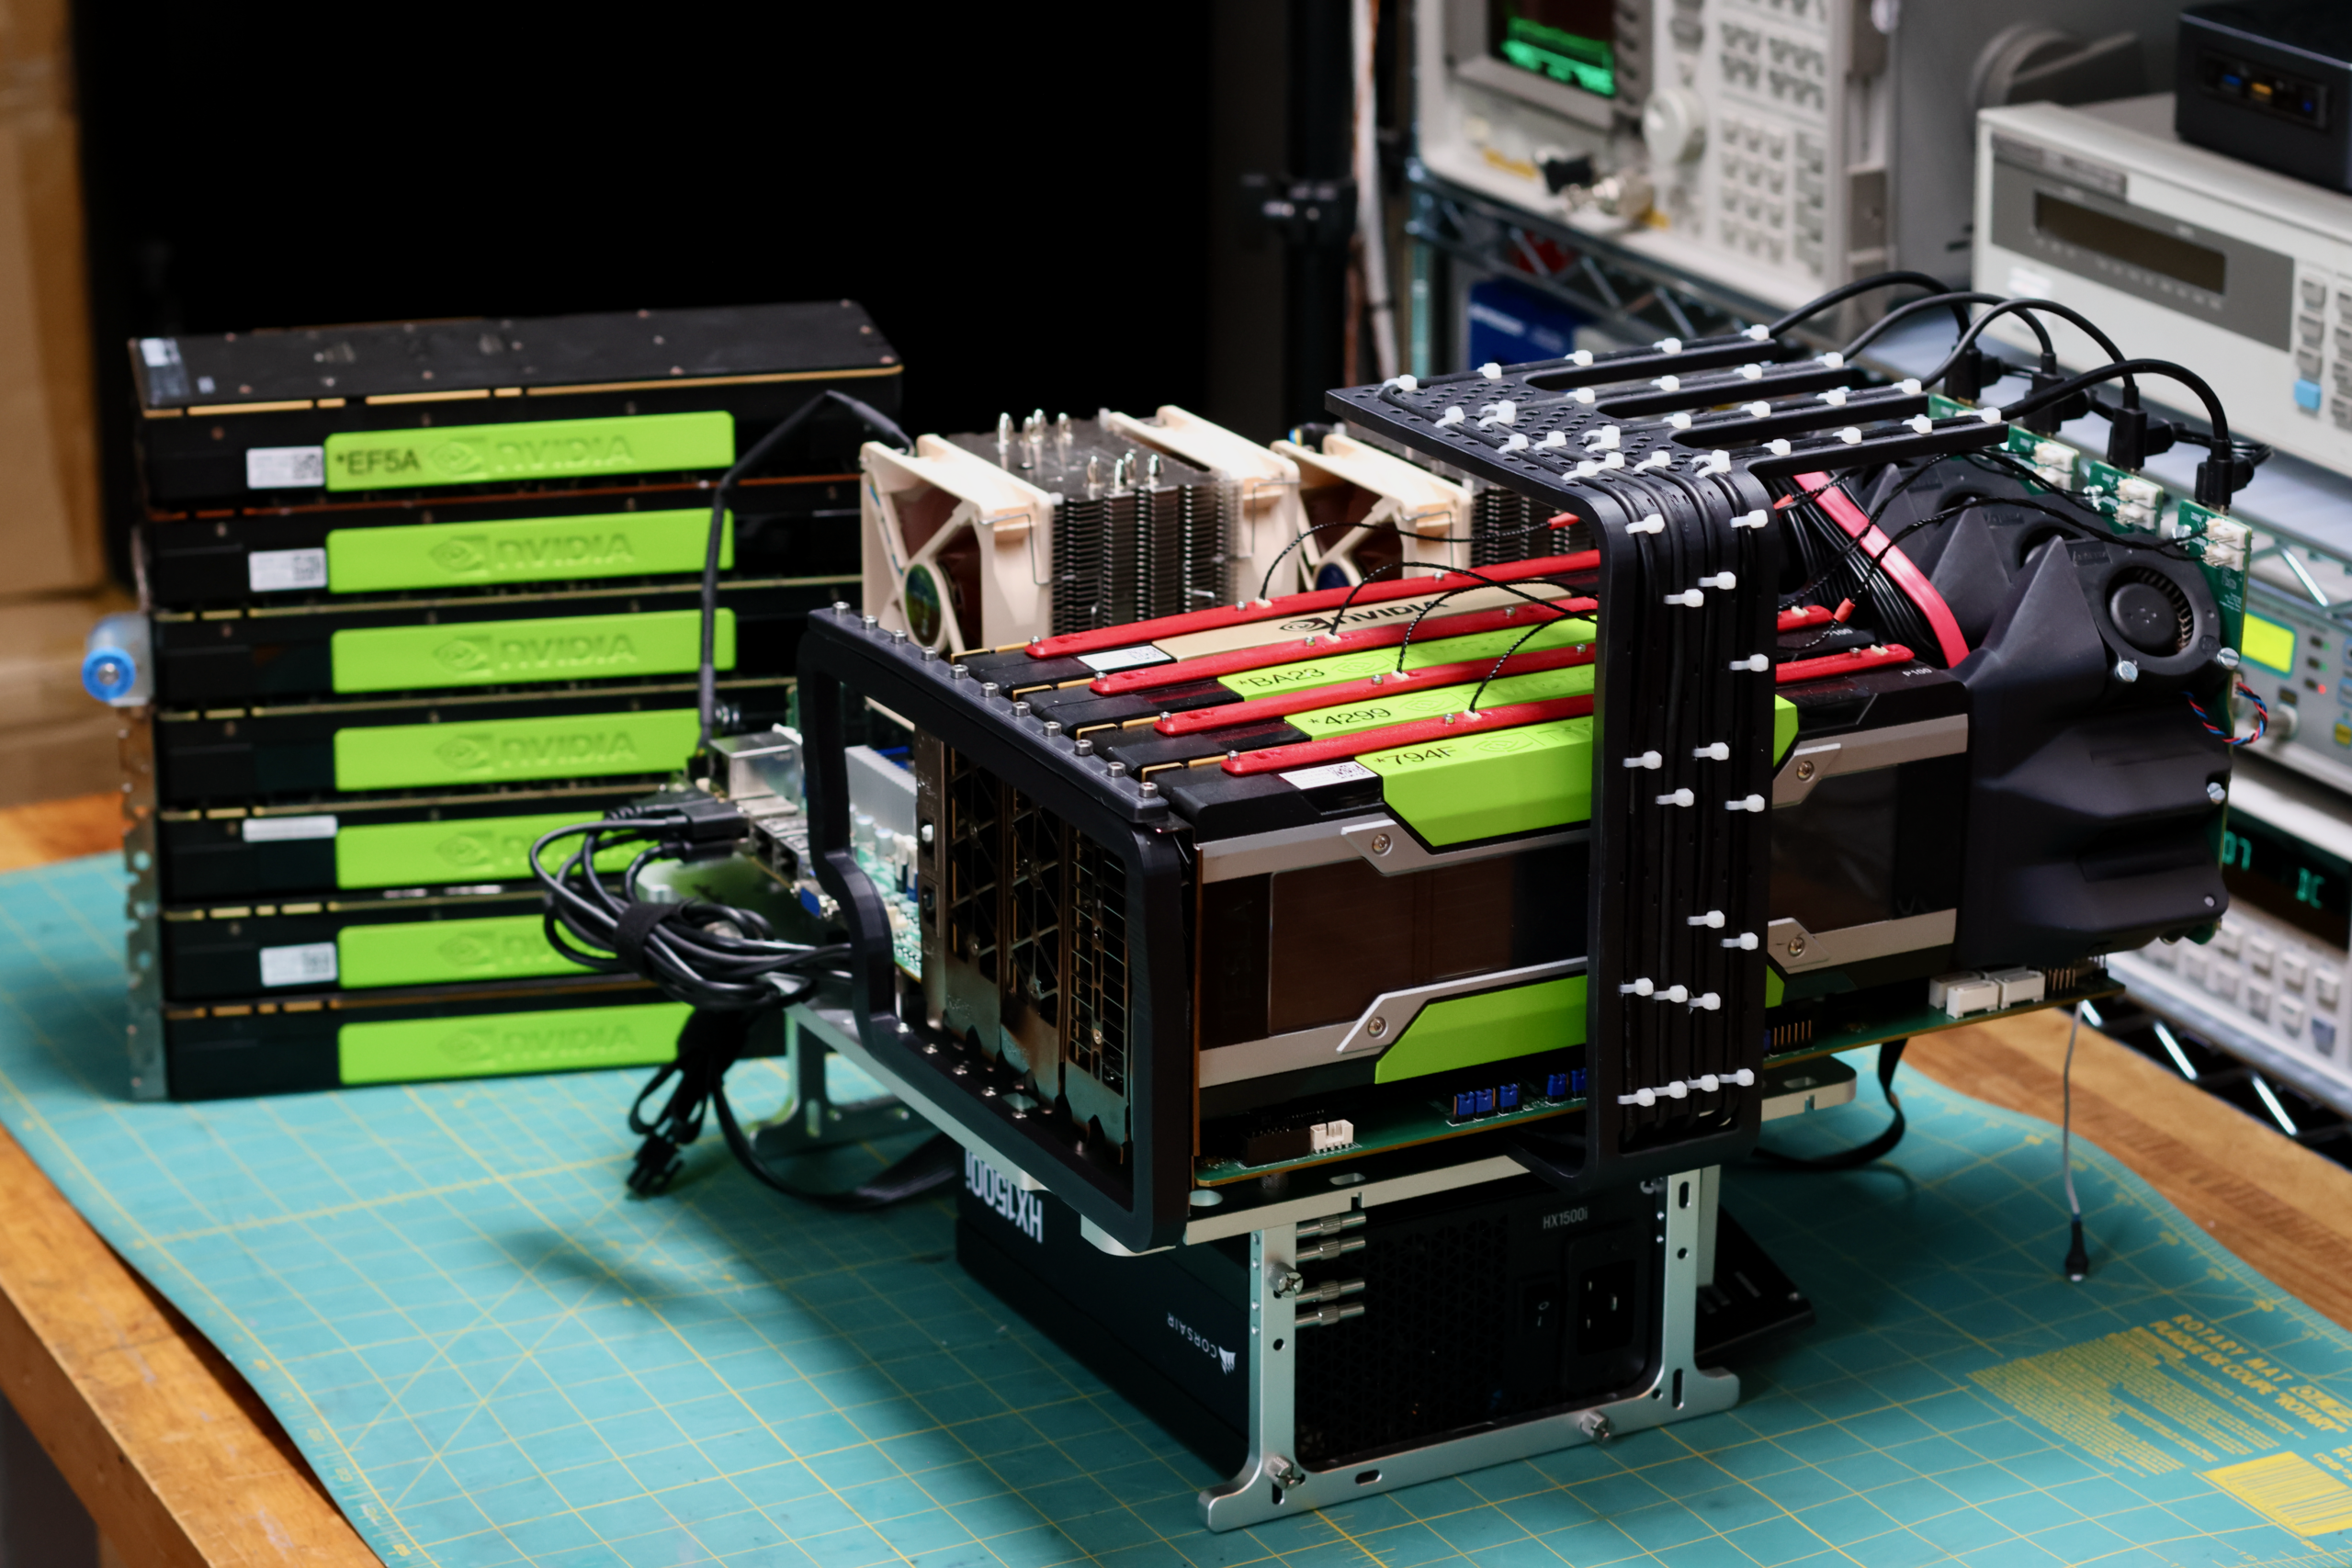
The plan for a while has been to use the Asus X99-WS motherboard and a few different types of Intel Xeon CPUs. Pictured above isn’t that board, it is the dual socketed supermicro X10DRG-Q. I lost a lot of time trying to get 3+ GPUs working on Asus X99-WS, but ran into a lot of stability problems. Maybe it’s my copy of the board, but it’s likely related to the limited number of PCIe lanes exposed by the CPU.
I don’t think any of the X99 CPUs could support four x16 PCIe cards on their own. I ended up getting a great deal on the X10DRG-Q and have been able to run four GPUs and a 10GB dual ethernet NIC as well without issues. So in the benchmark runs, I’ll likely do all of the GPU swapping with this motherboard. Then once a winning combo of GPUs is found, I’ll try it on more boards.
With the new motherboard I had to redesign the PCIe Bracket Mount for the OBT. The one pictured above has some problems, once this new design is finalized I’ll upload it to the printables page.