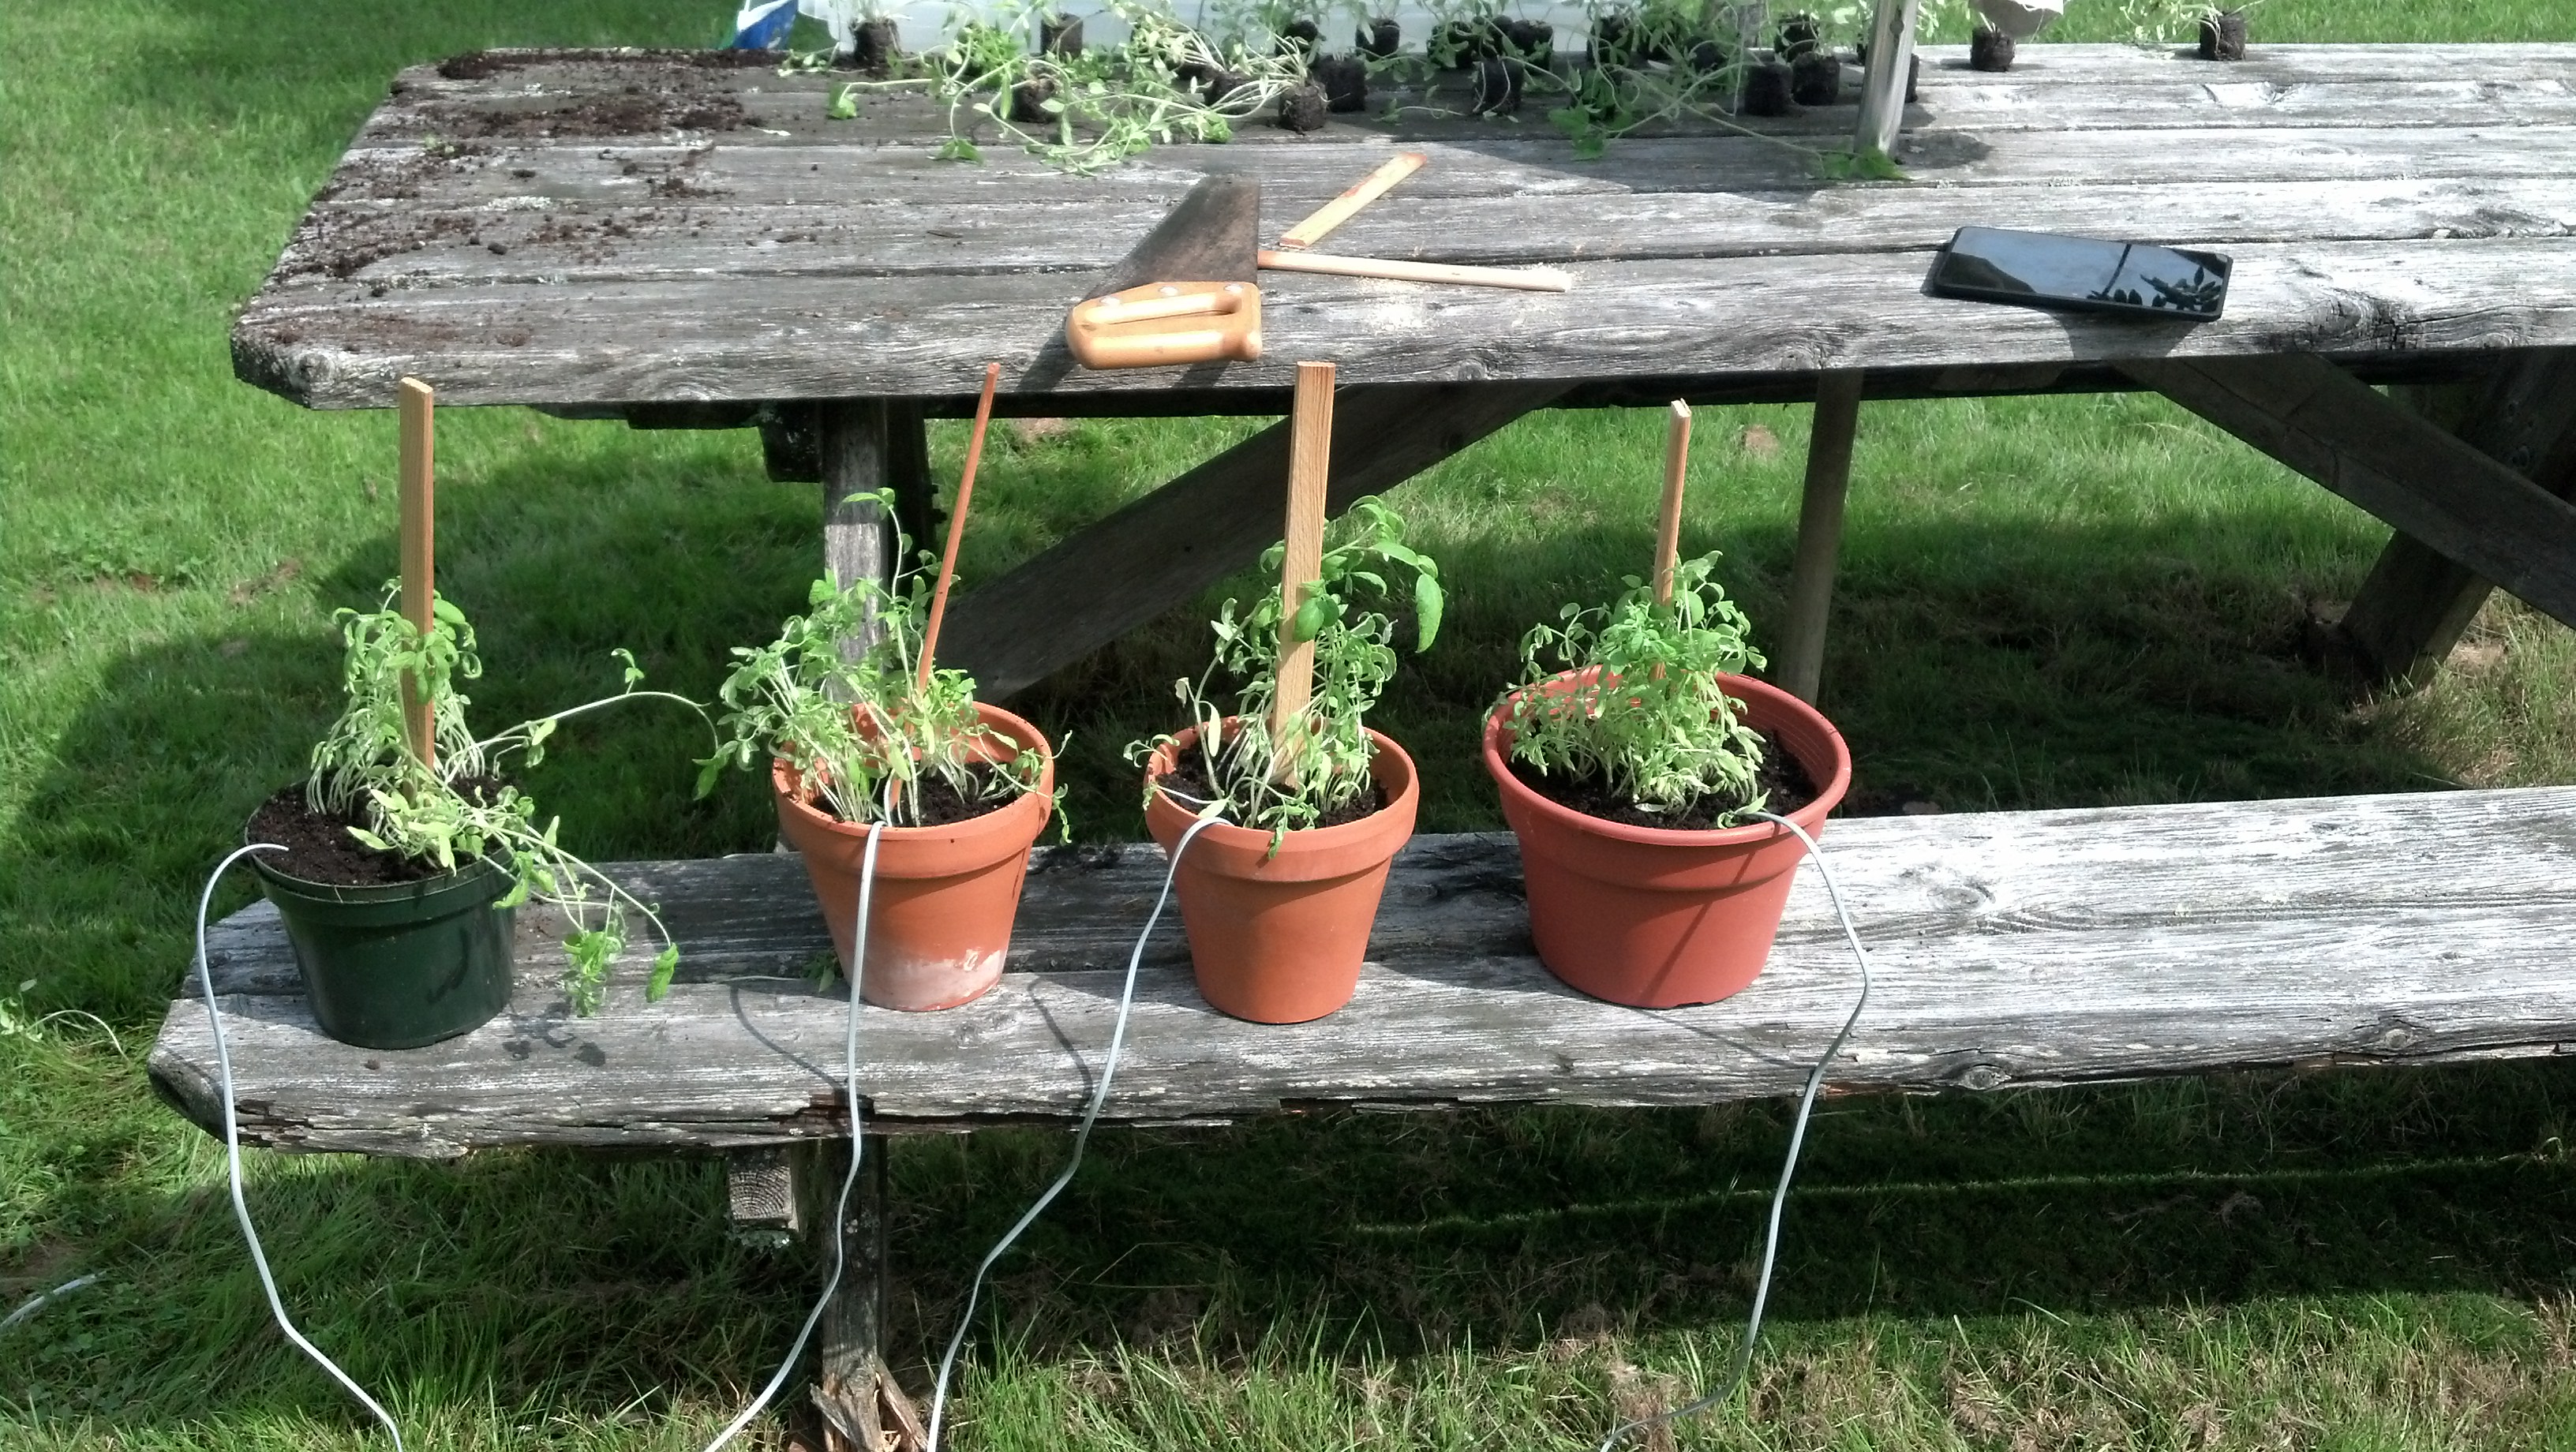
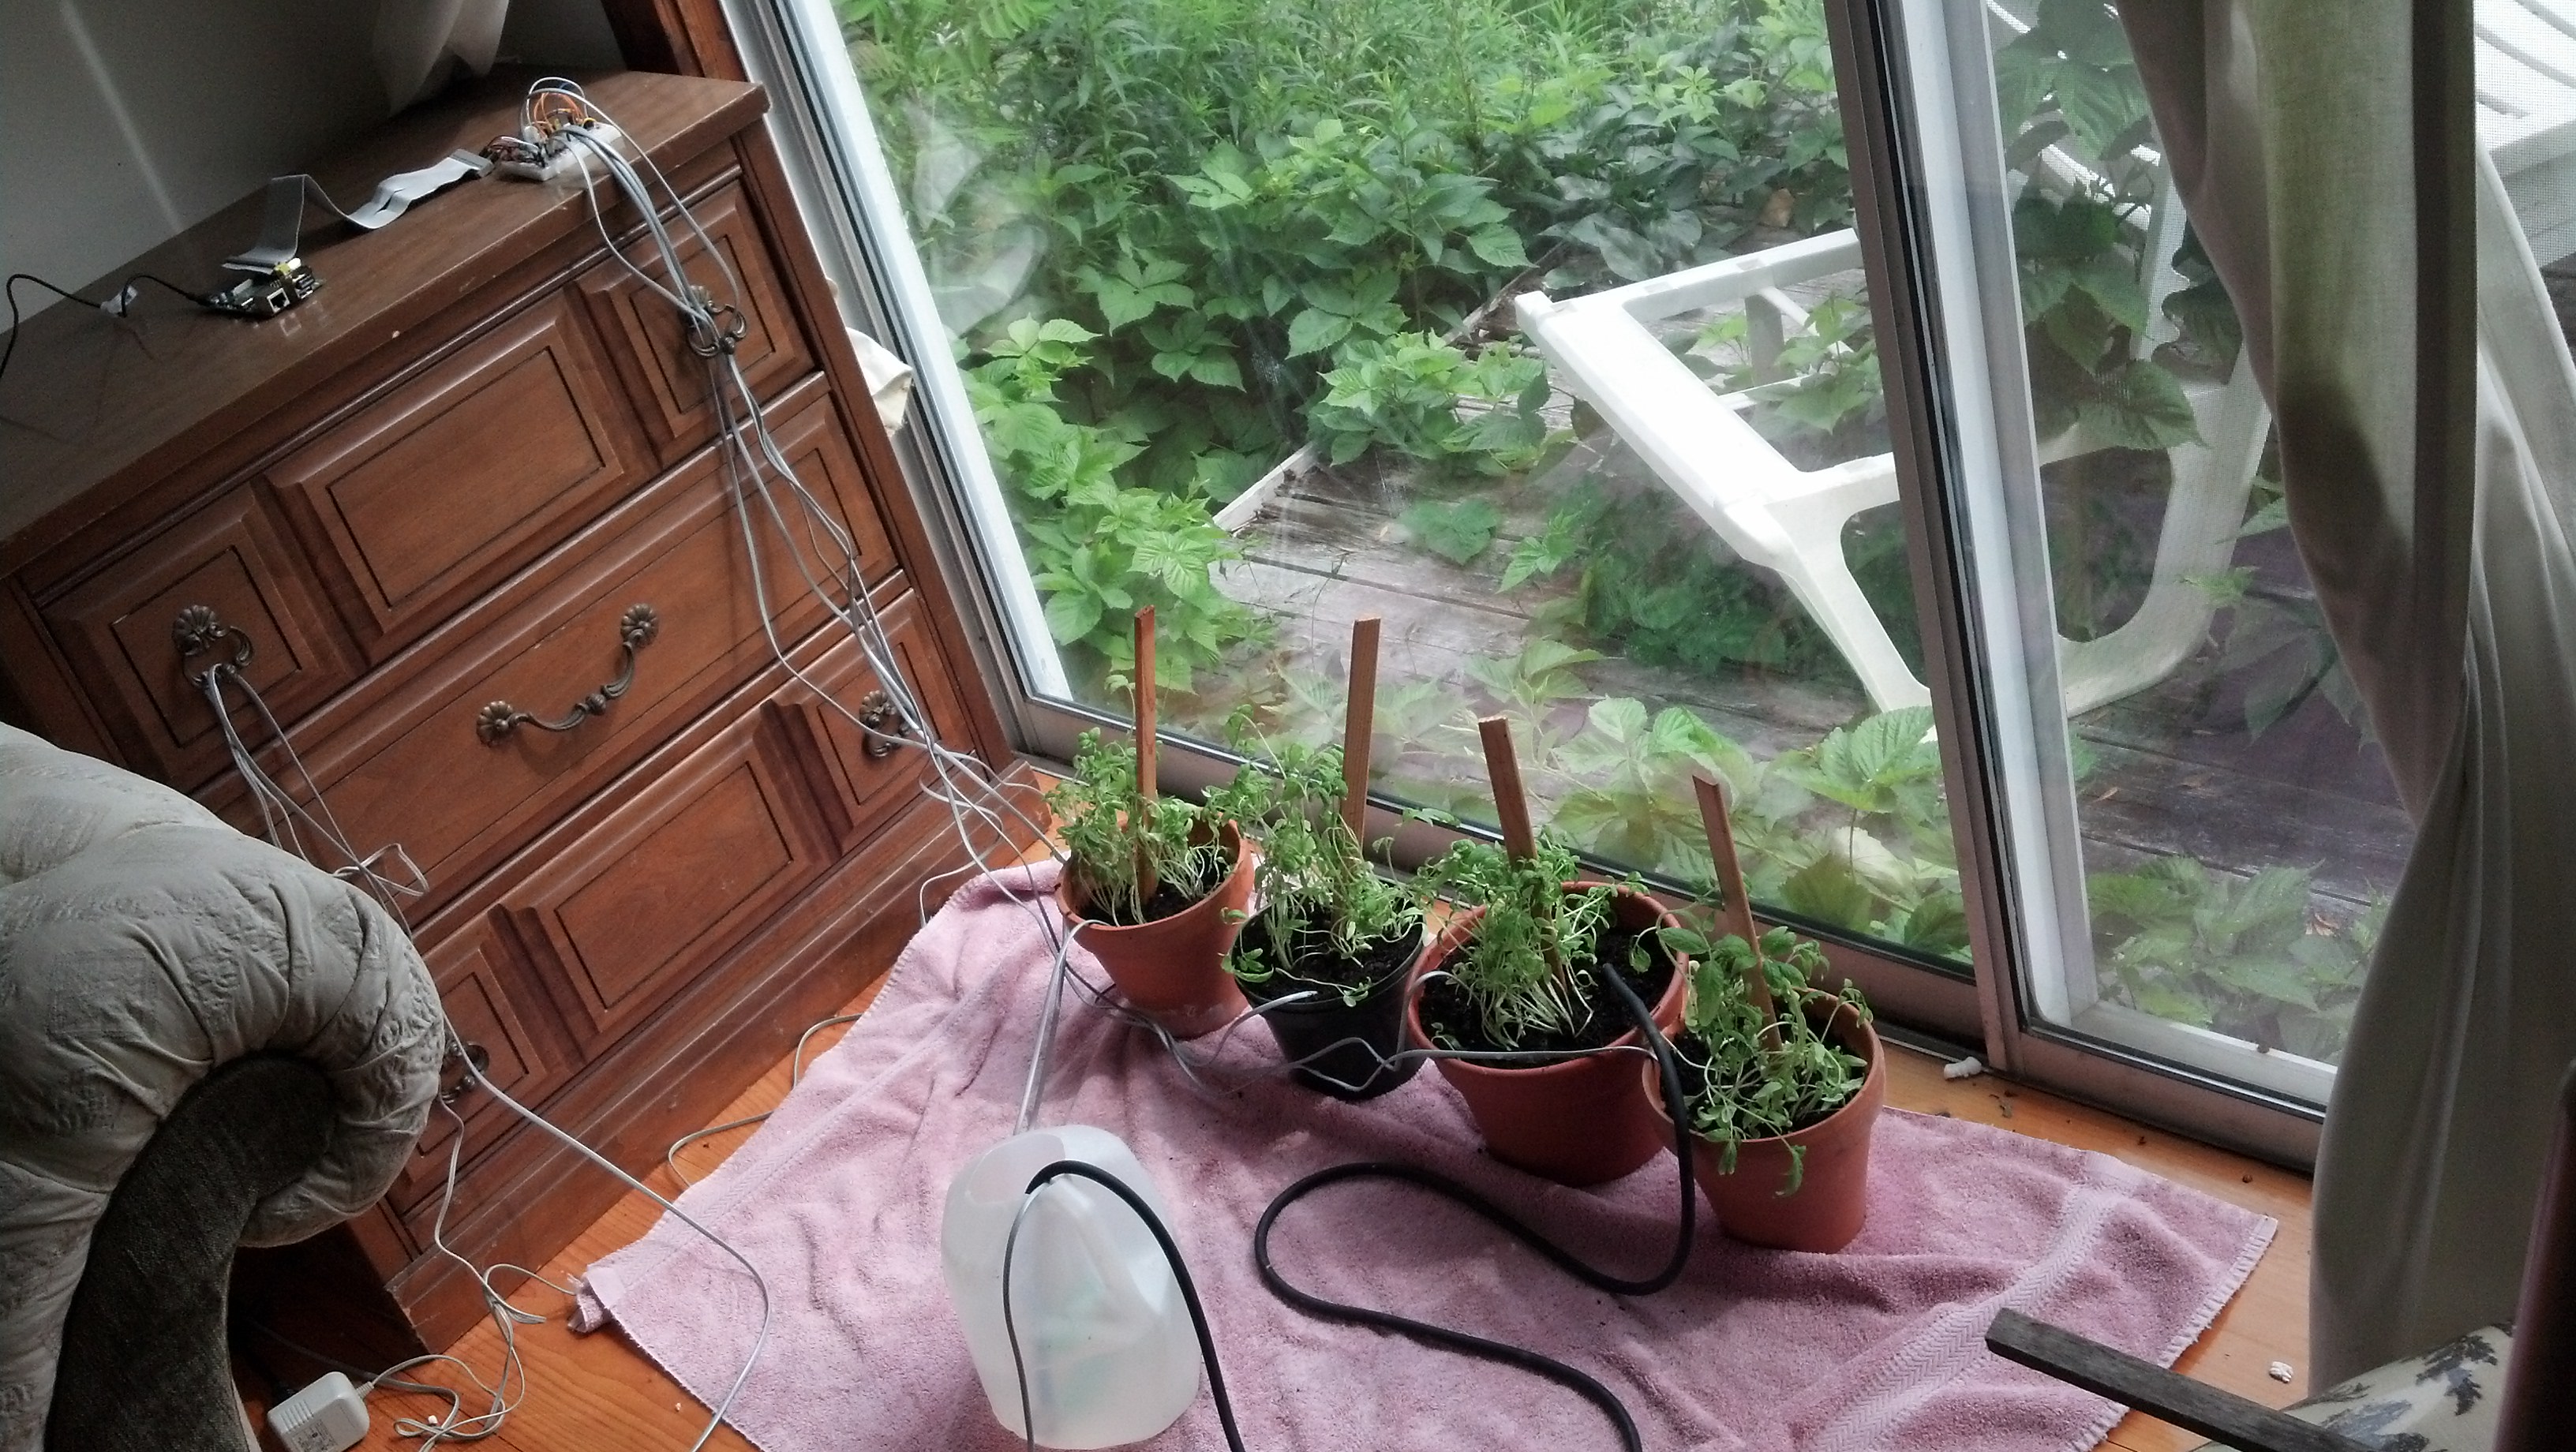
Hi! I moved the plants out of the bin and into 4 different pots, here are a few pictures of that process:
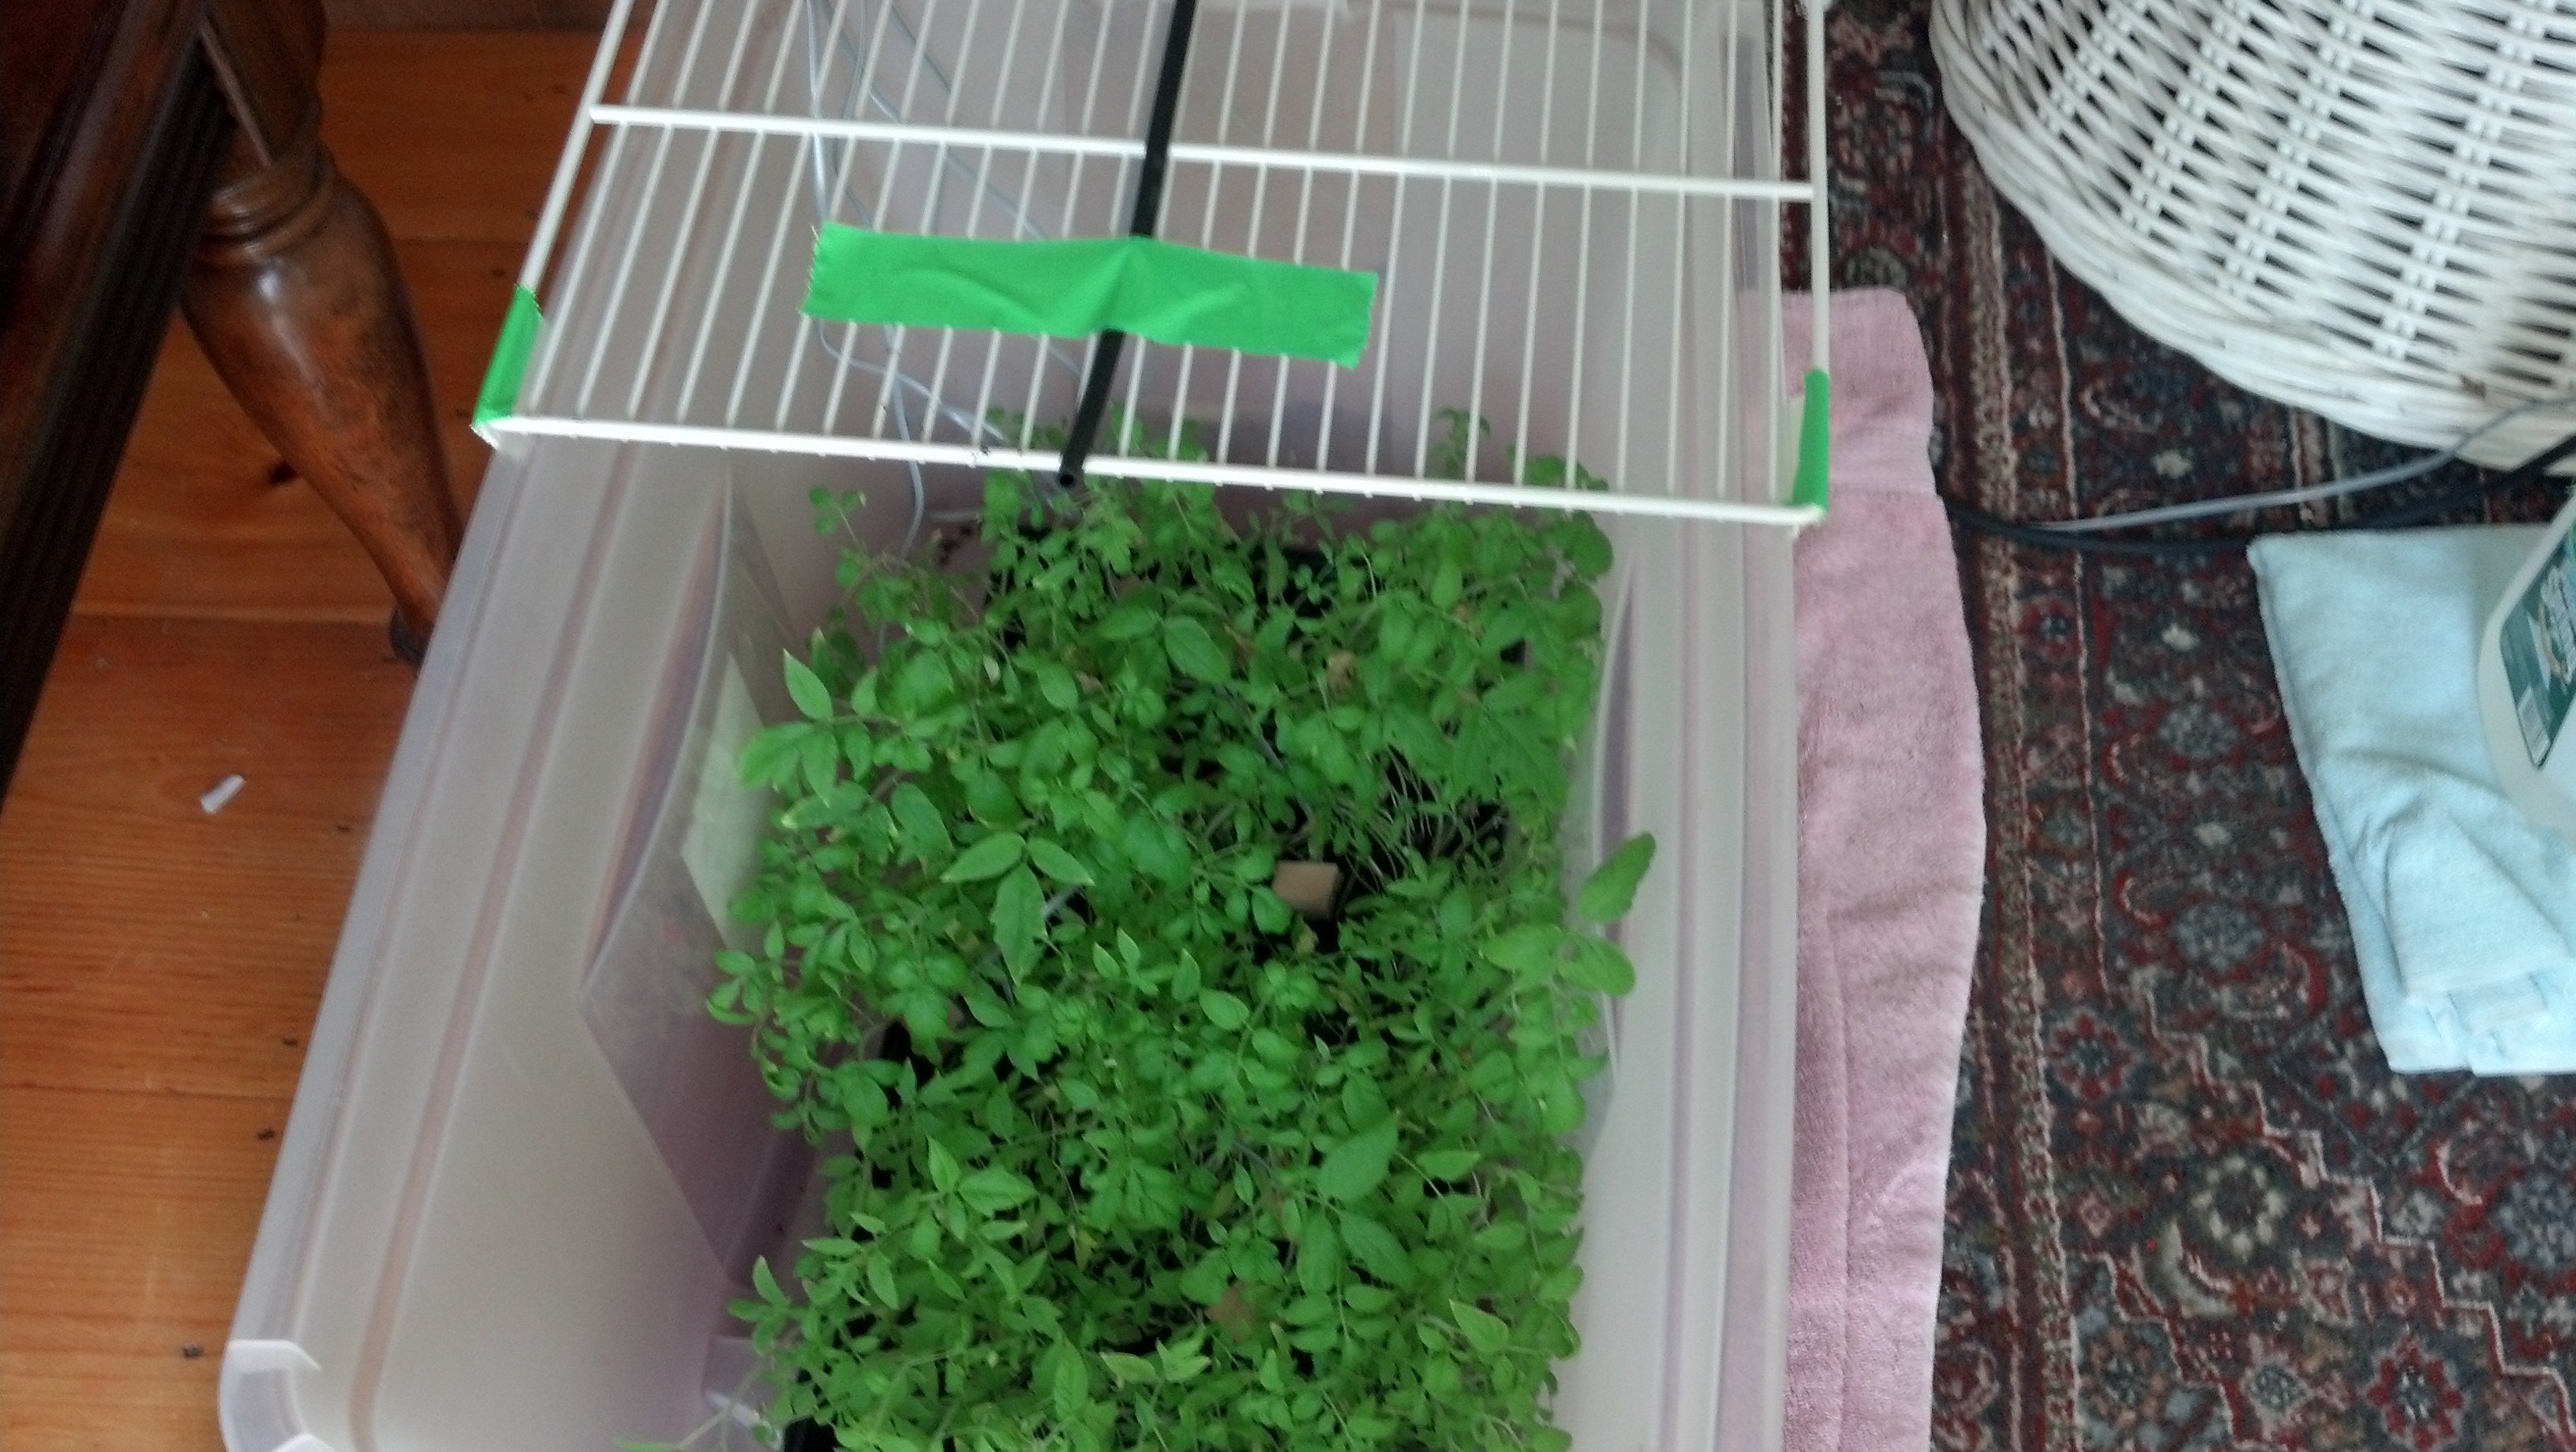
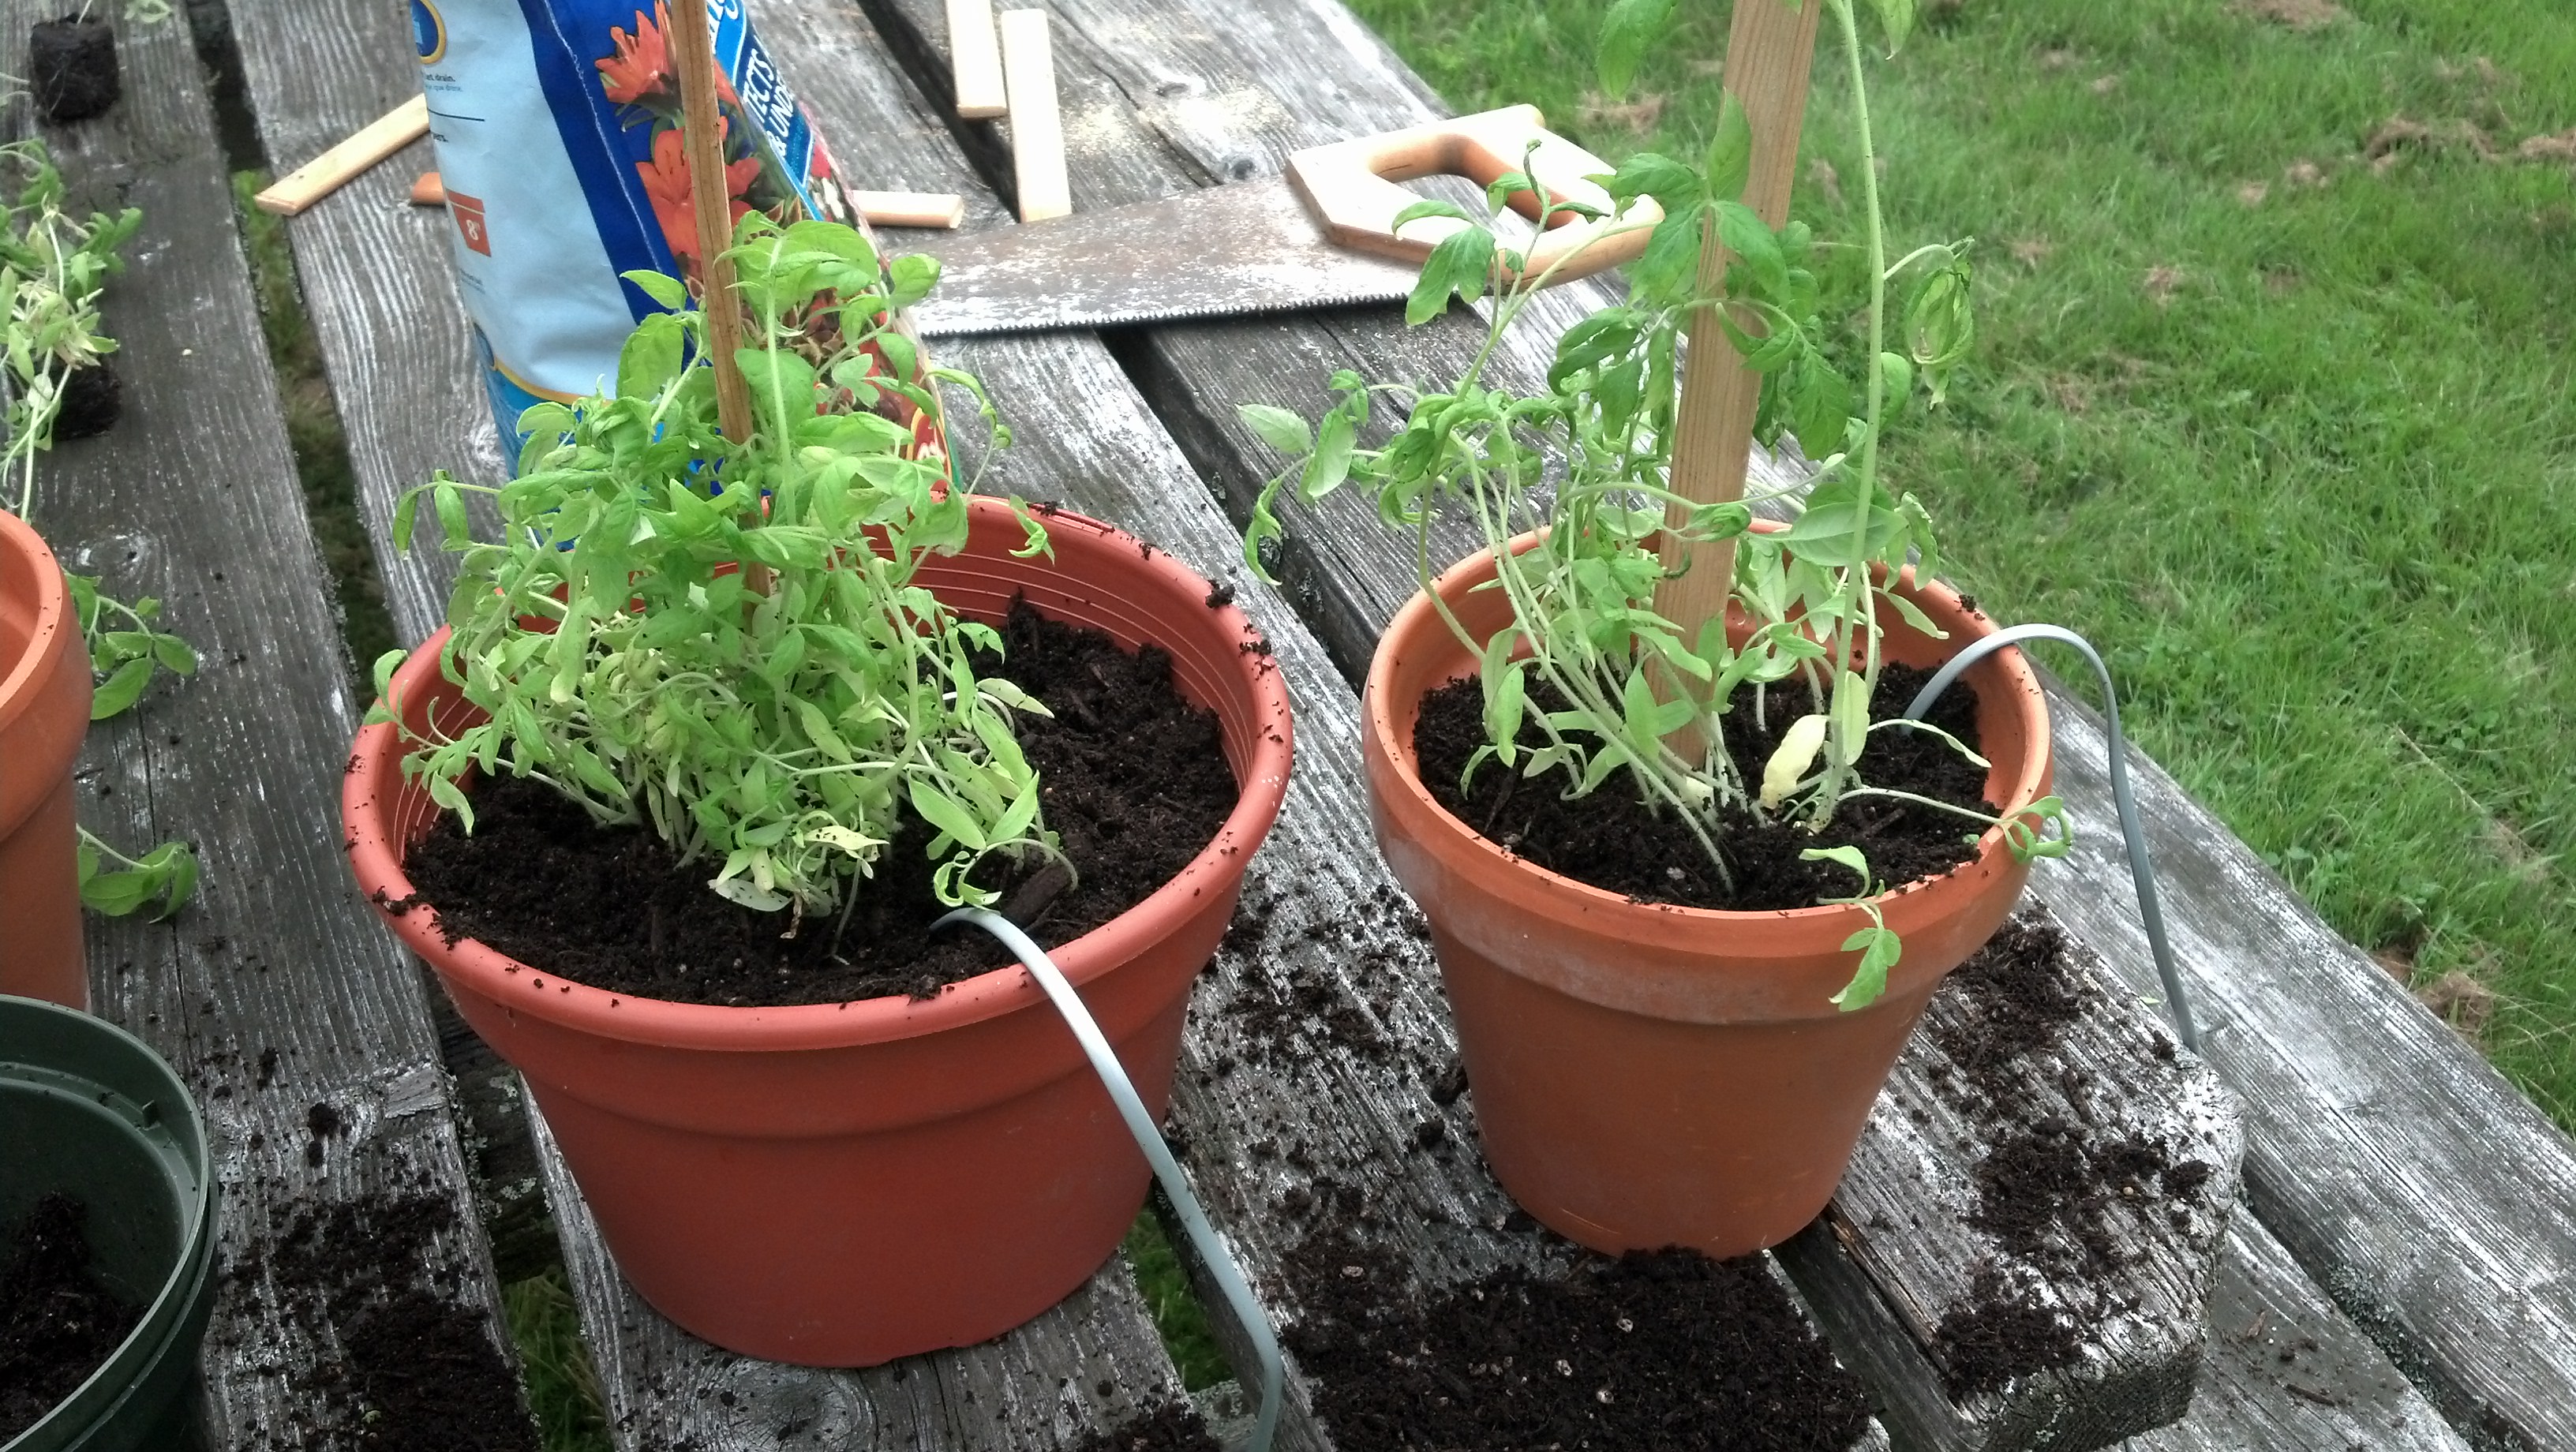
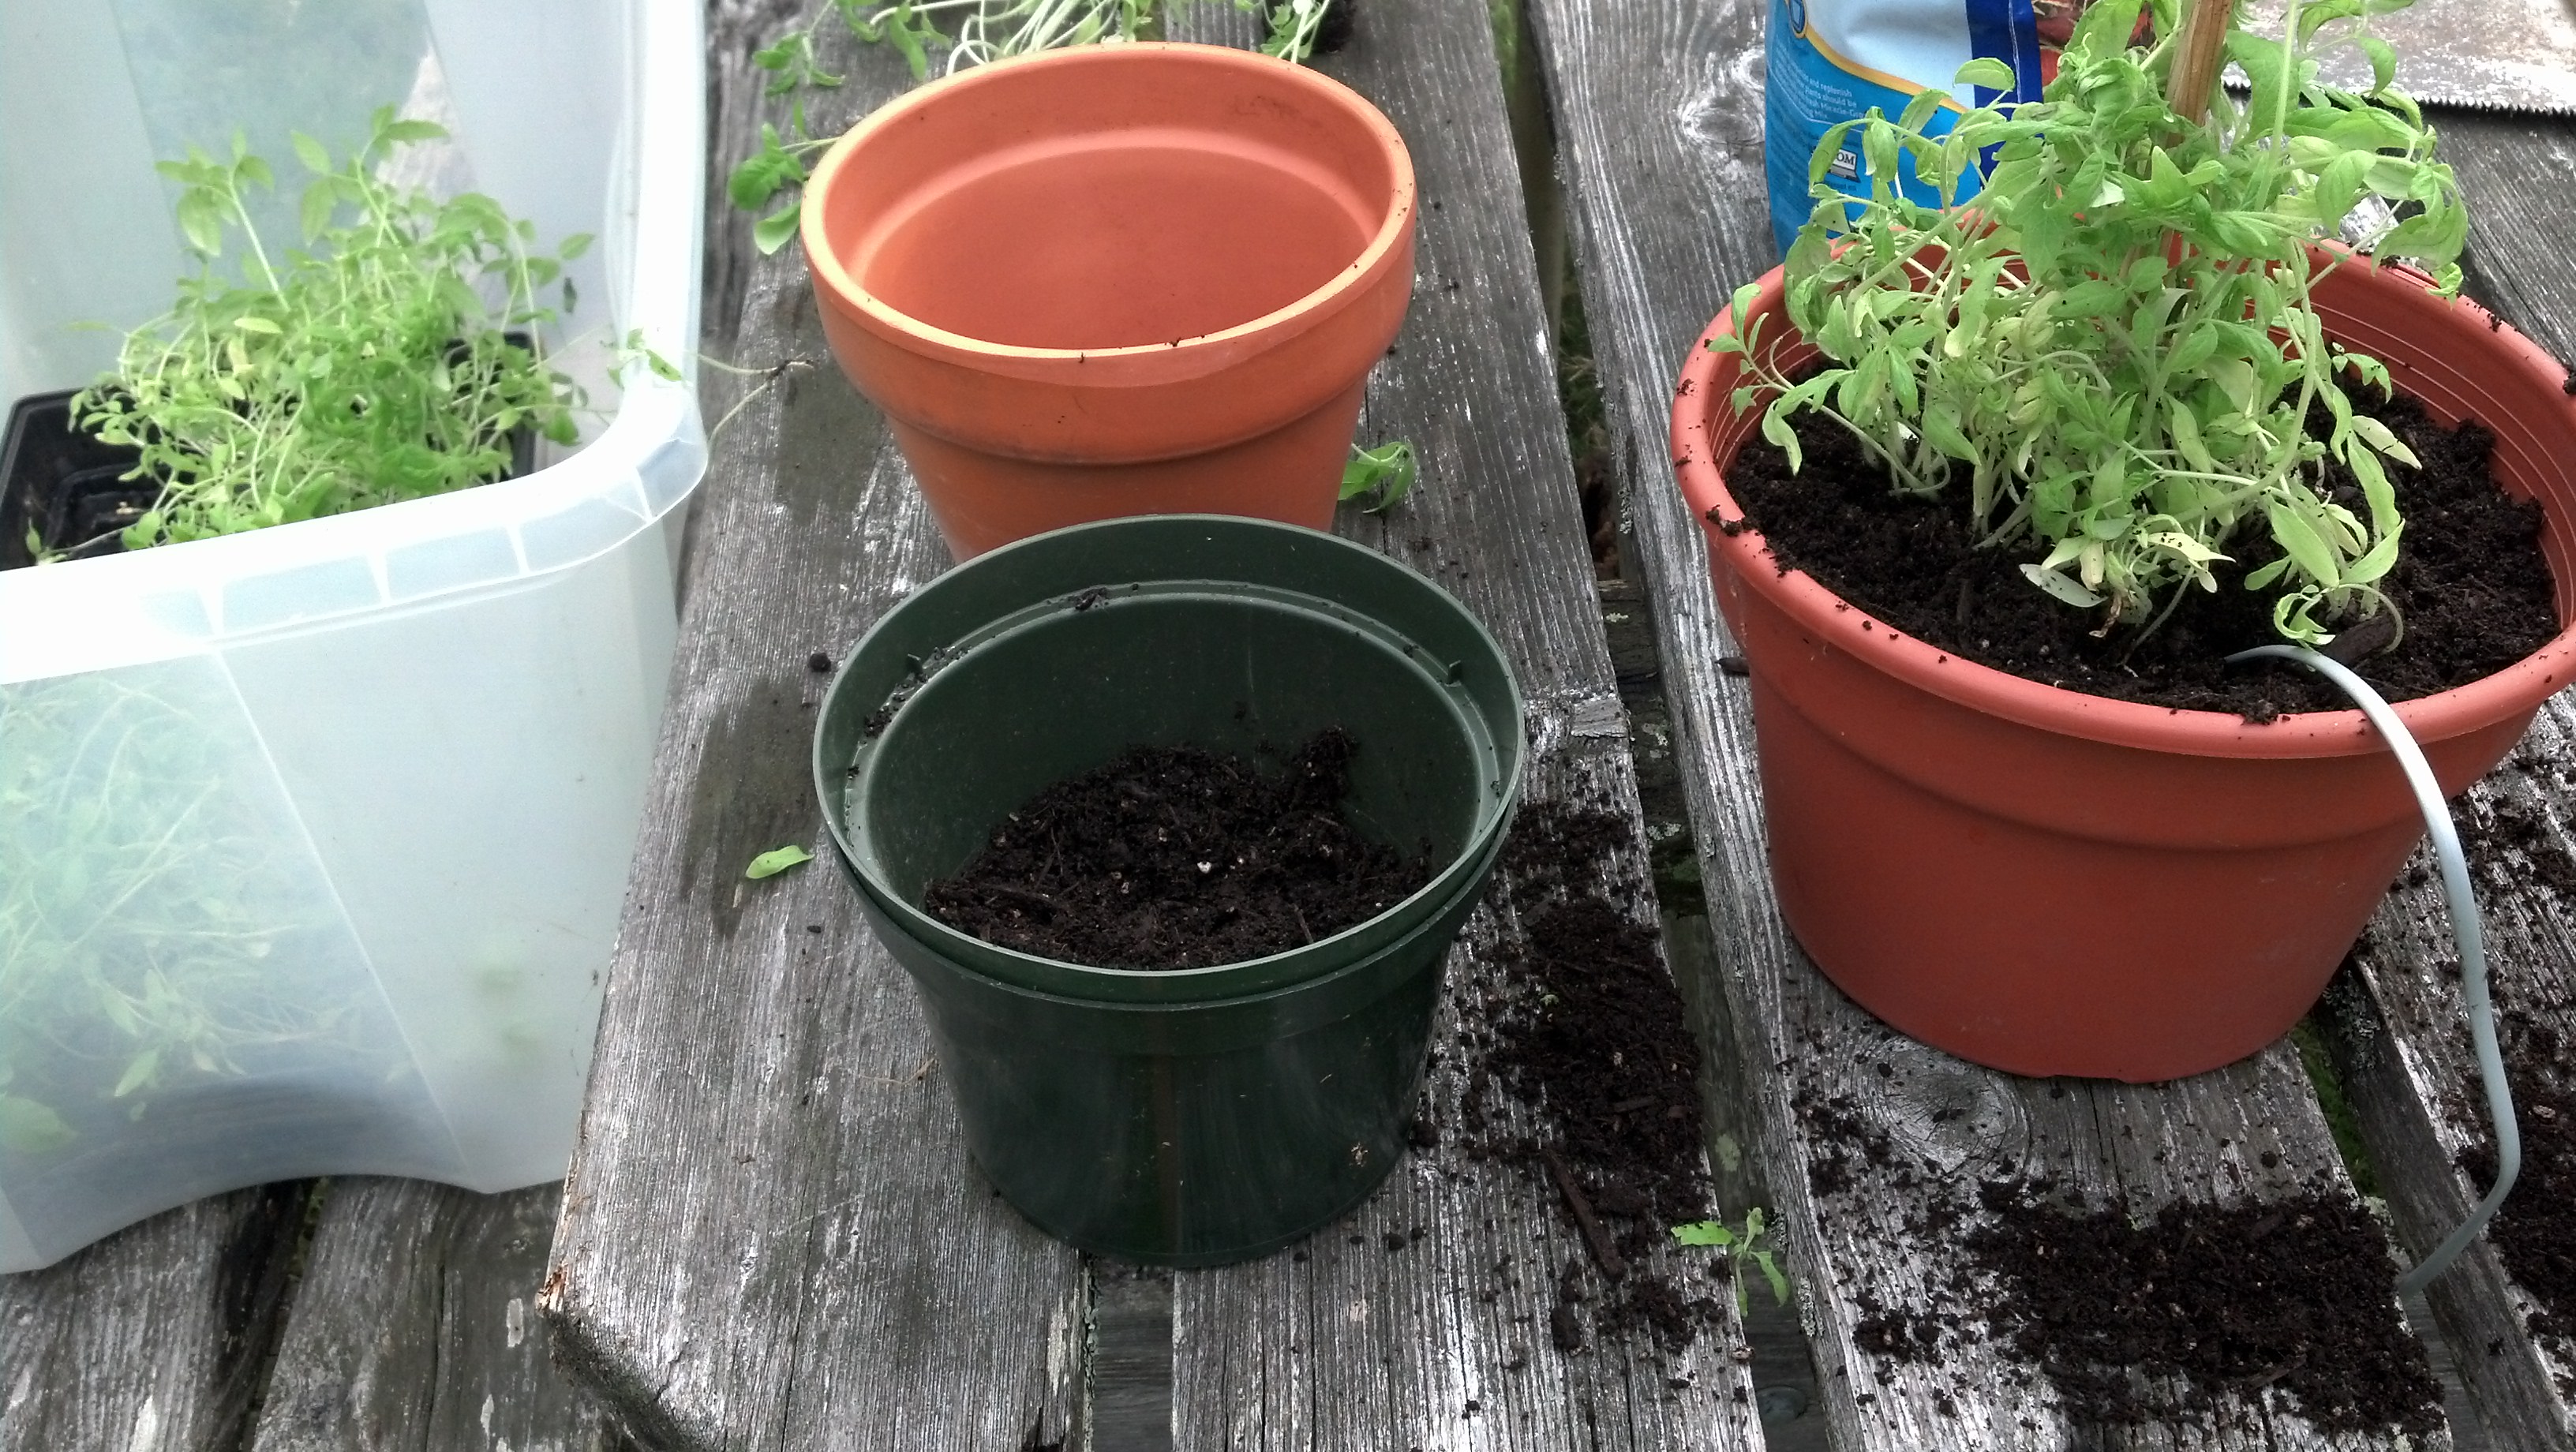
I need to think of a new way to water all 4 plants…
Hi! I moved the plants out of the bin and into 4 different pots, here are a few pictures of that process:
I need to think of a new way to water all 4 plants…

This post is many months in the making and I am very proud of the thing’s I’ve done here, and very thankful to all of those (specifically at www.reddit.com/r/raspberry_pi) who have helped me along my way to getting this project up and running.
Let’s get this going, here’s an overview video:
There are 8 parts to this system and, you guessed it, I’ll be going in-depth about every single one!
So at it’s core, the PiPlanter is a Sensor Network & Pump System. Here’s a video explaining the sensor array:
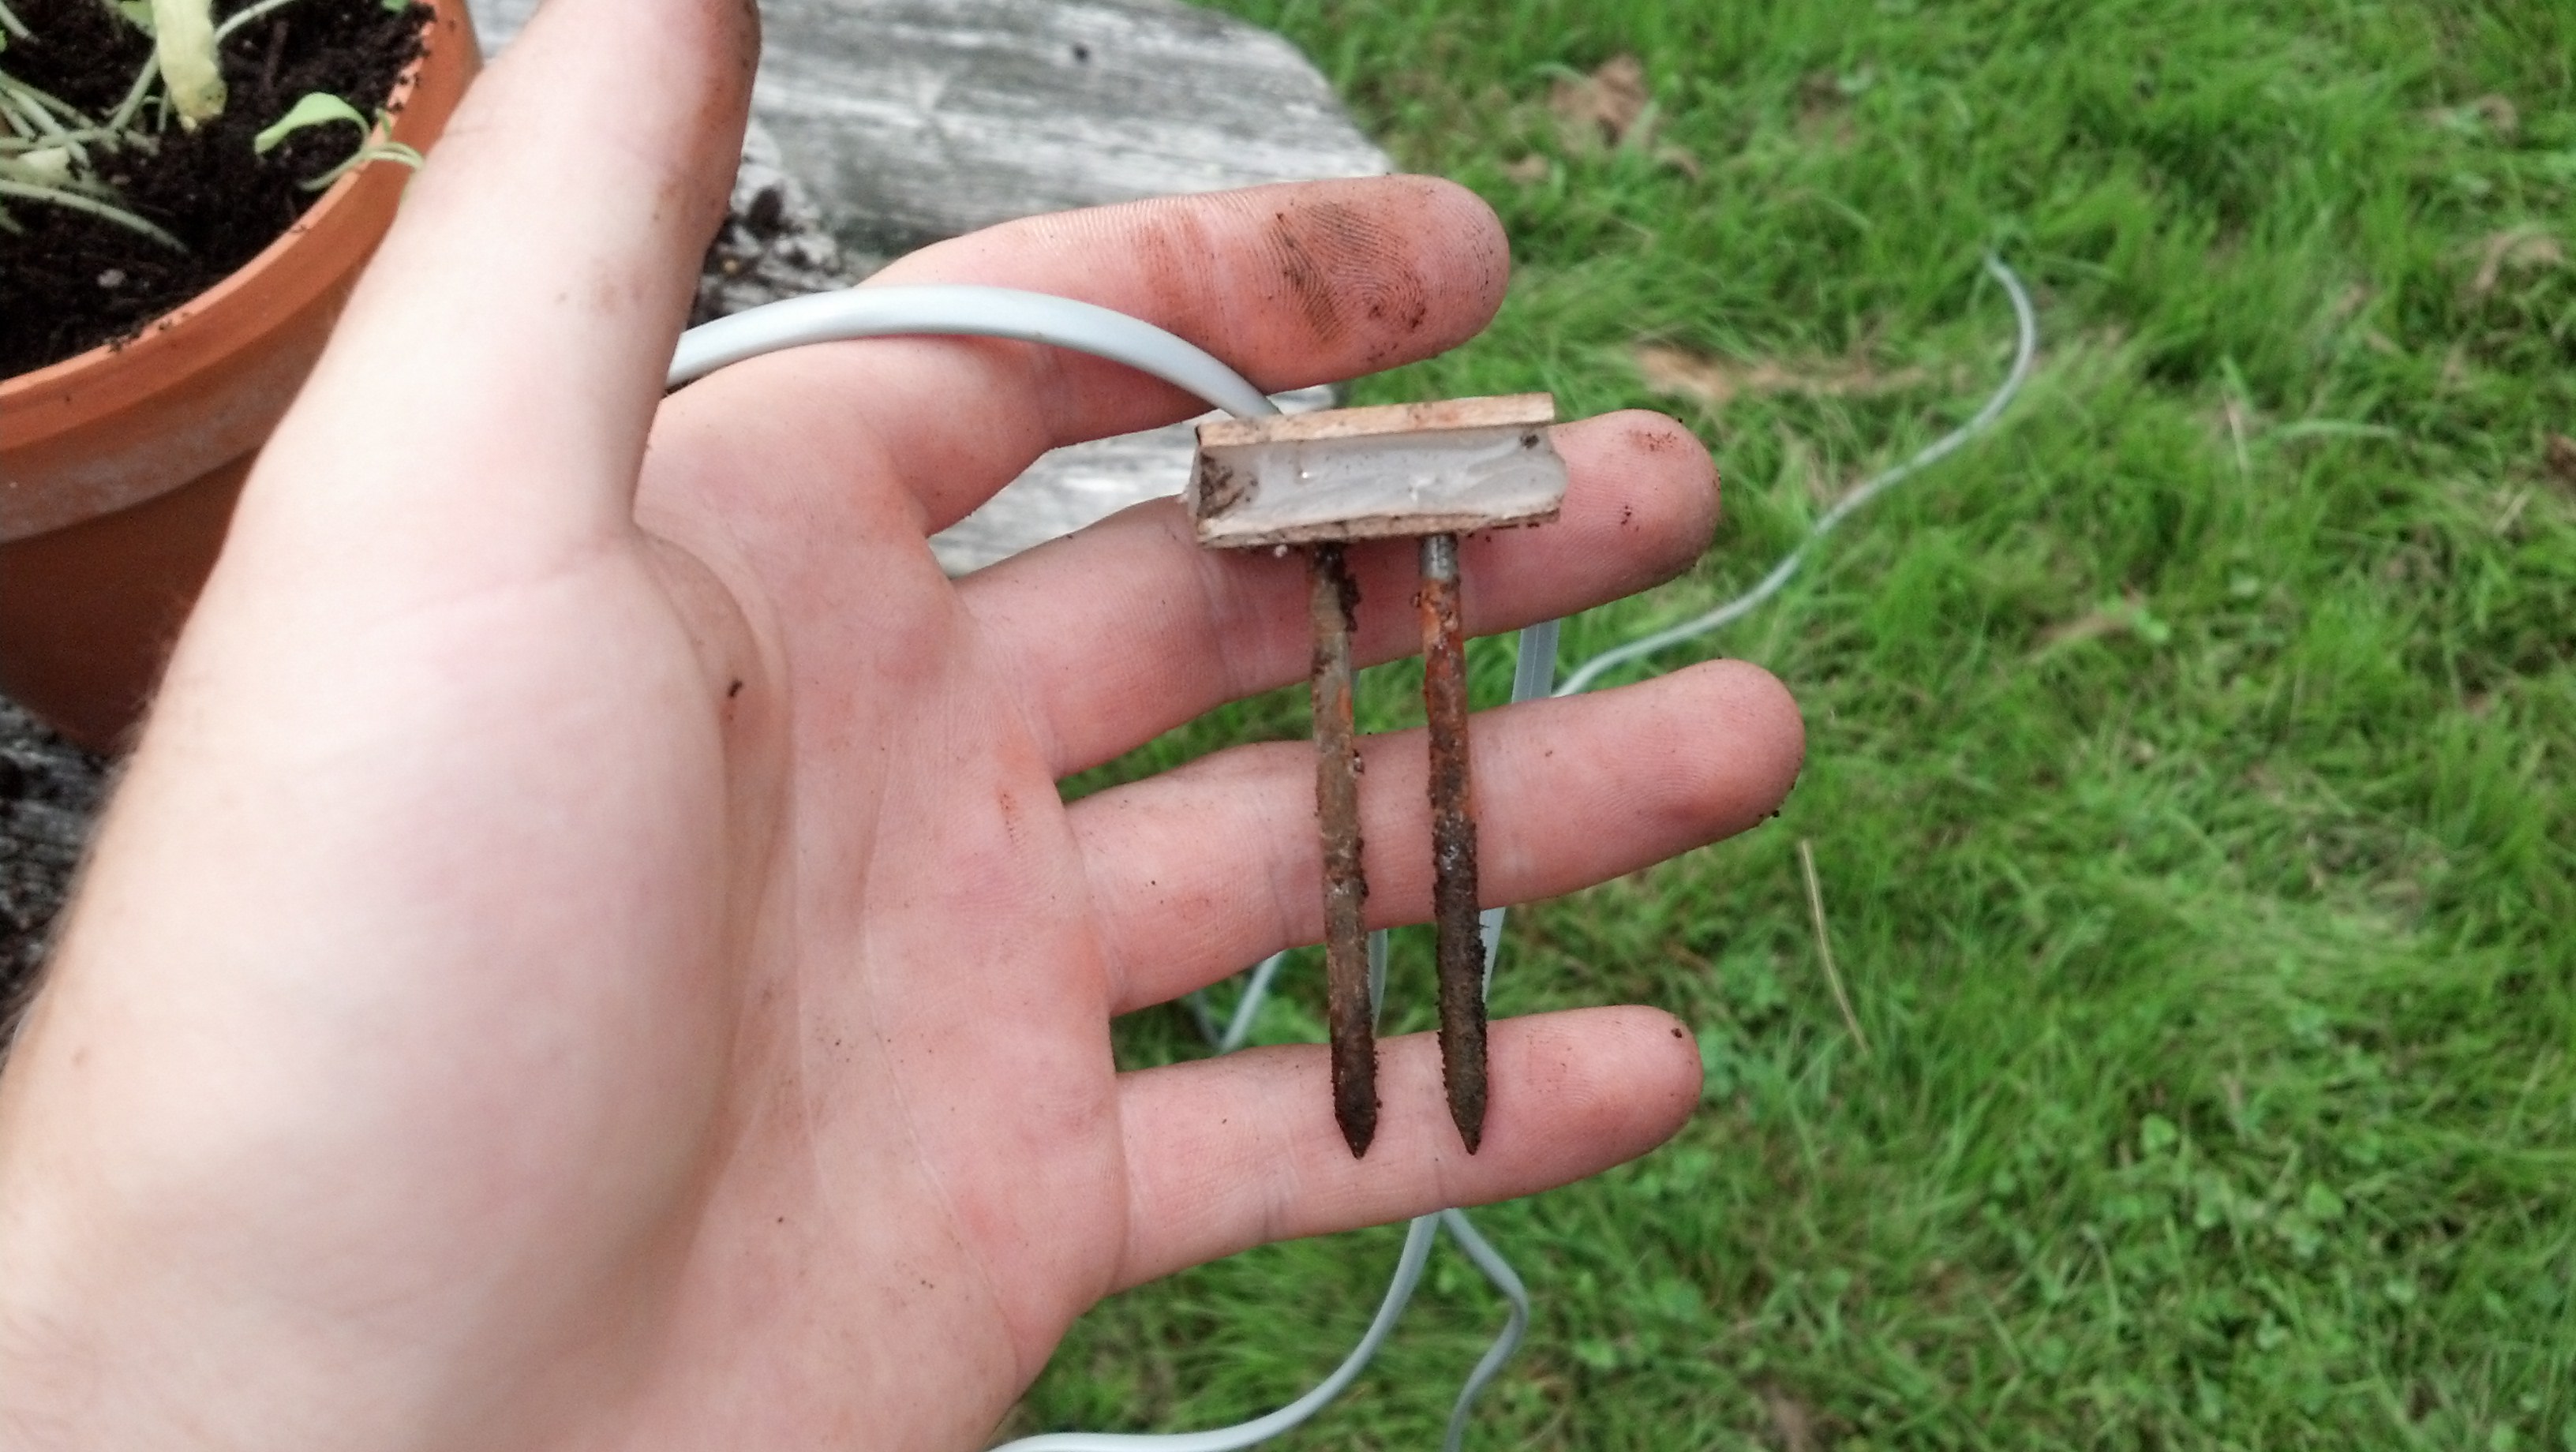
This project uses a TMP35-37 sensor to get a pretty precise temperature reading of the room. Later down in this post you can find out the algorithm to determine the temperature in Fahrenheit. It also uses a basic LDR to get the relative ambient light level in the room. Along with those two sensors, there are 4 relative humidity sensors of my own design, here’s a picture of them as seen in this post:
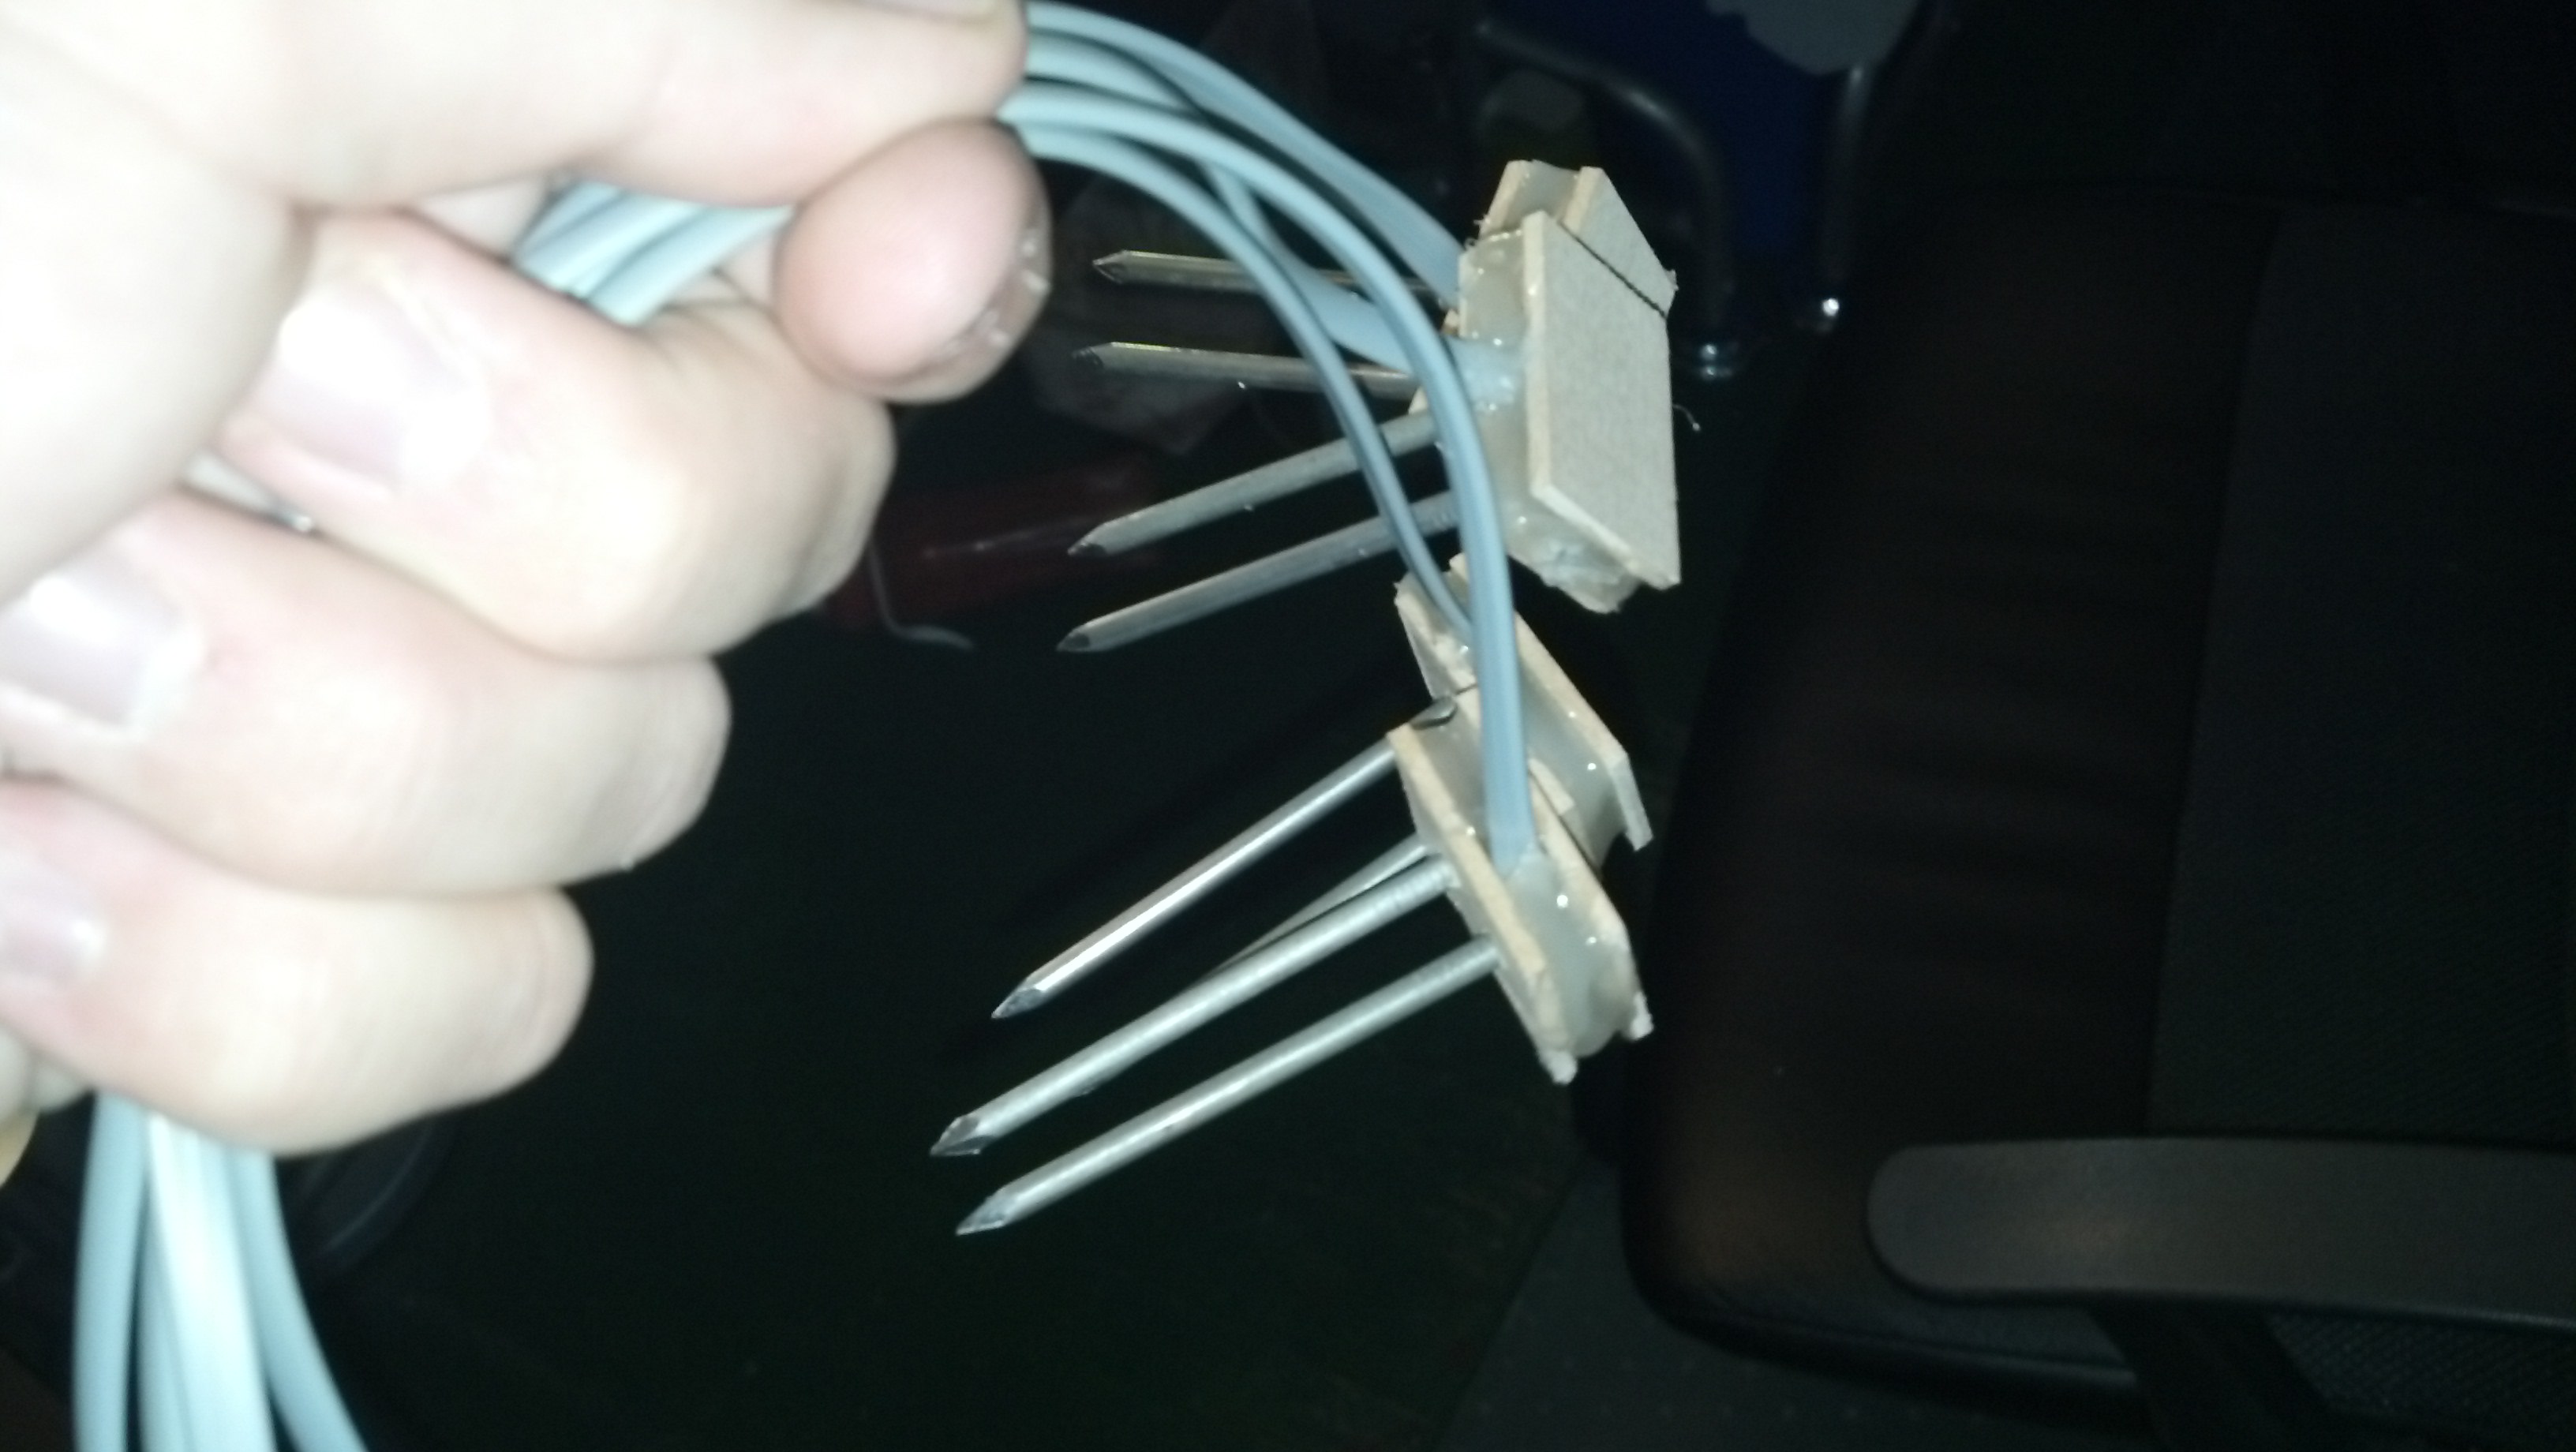
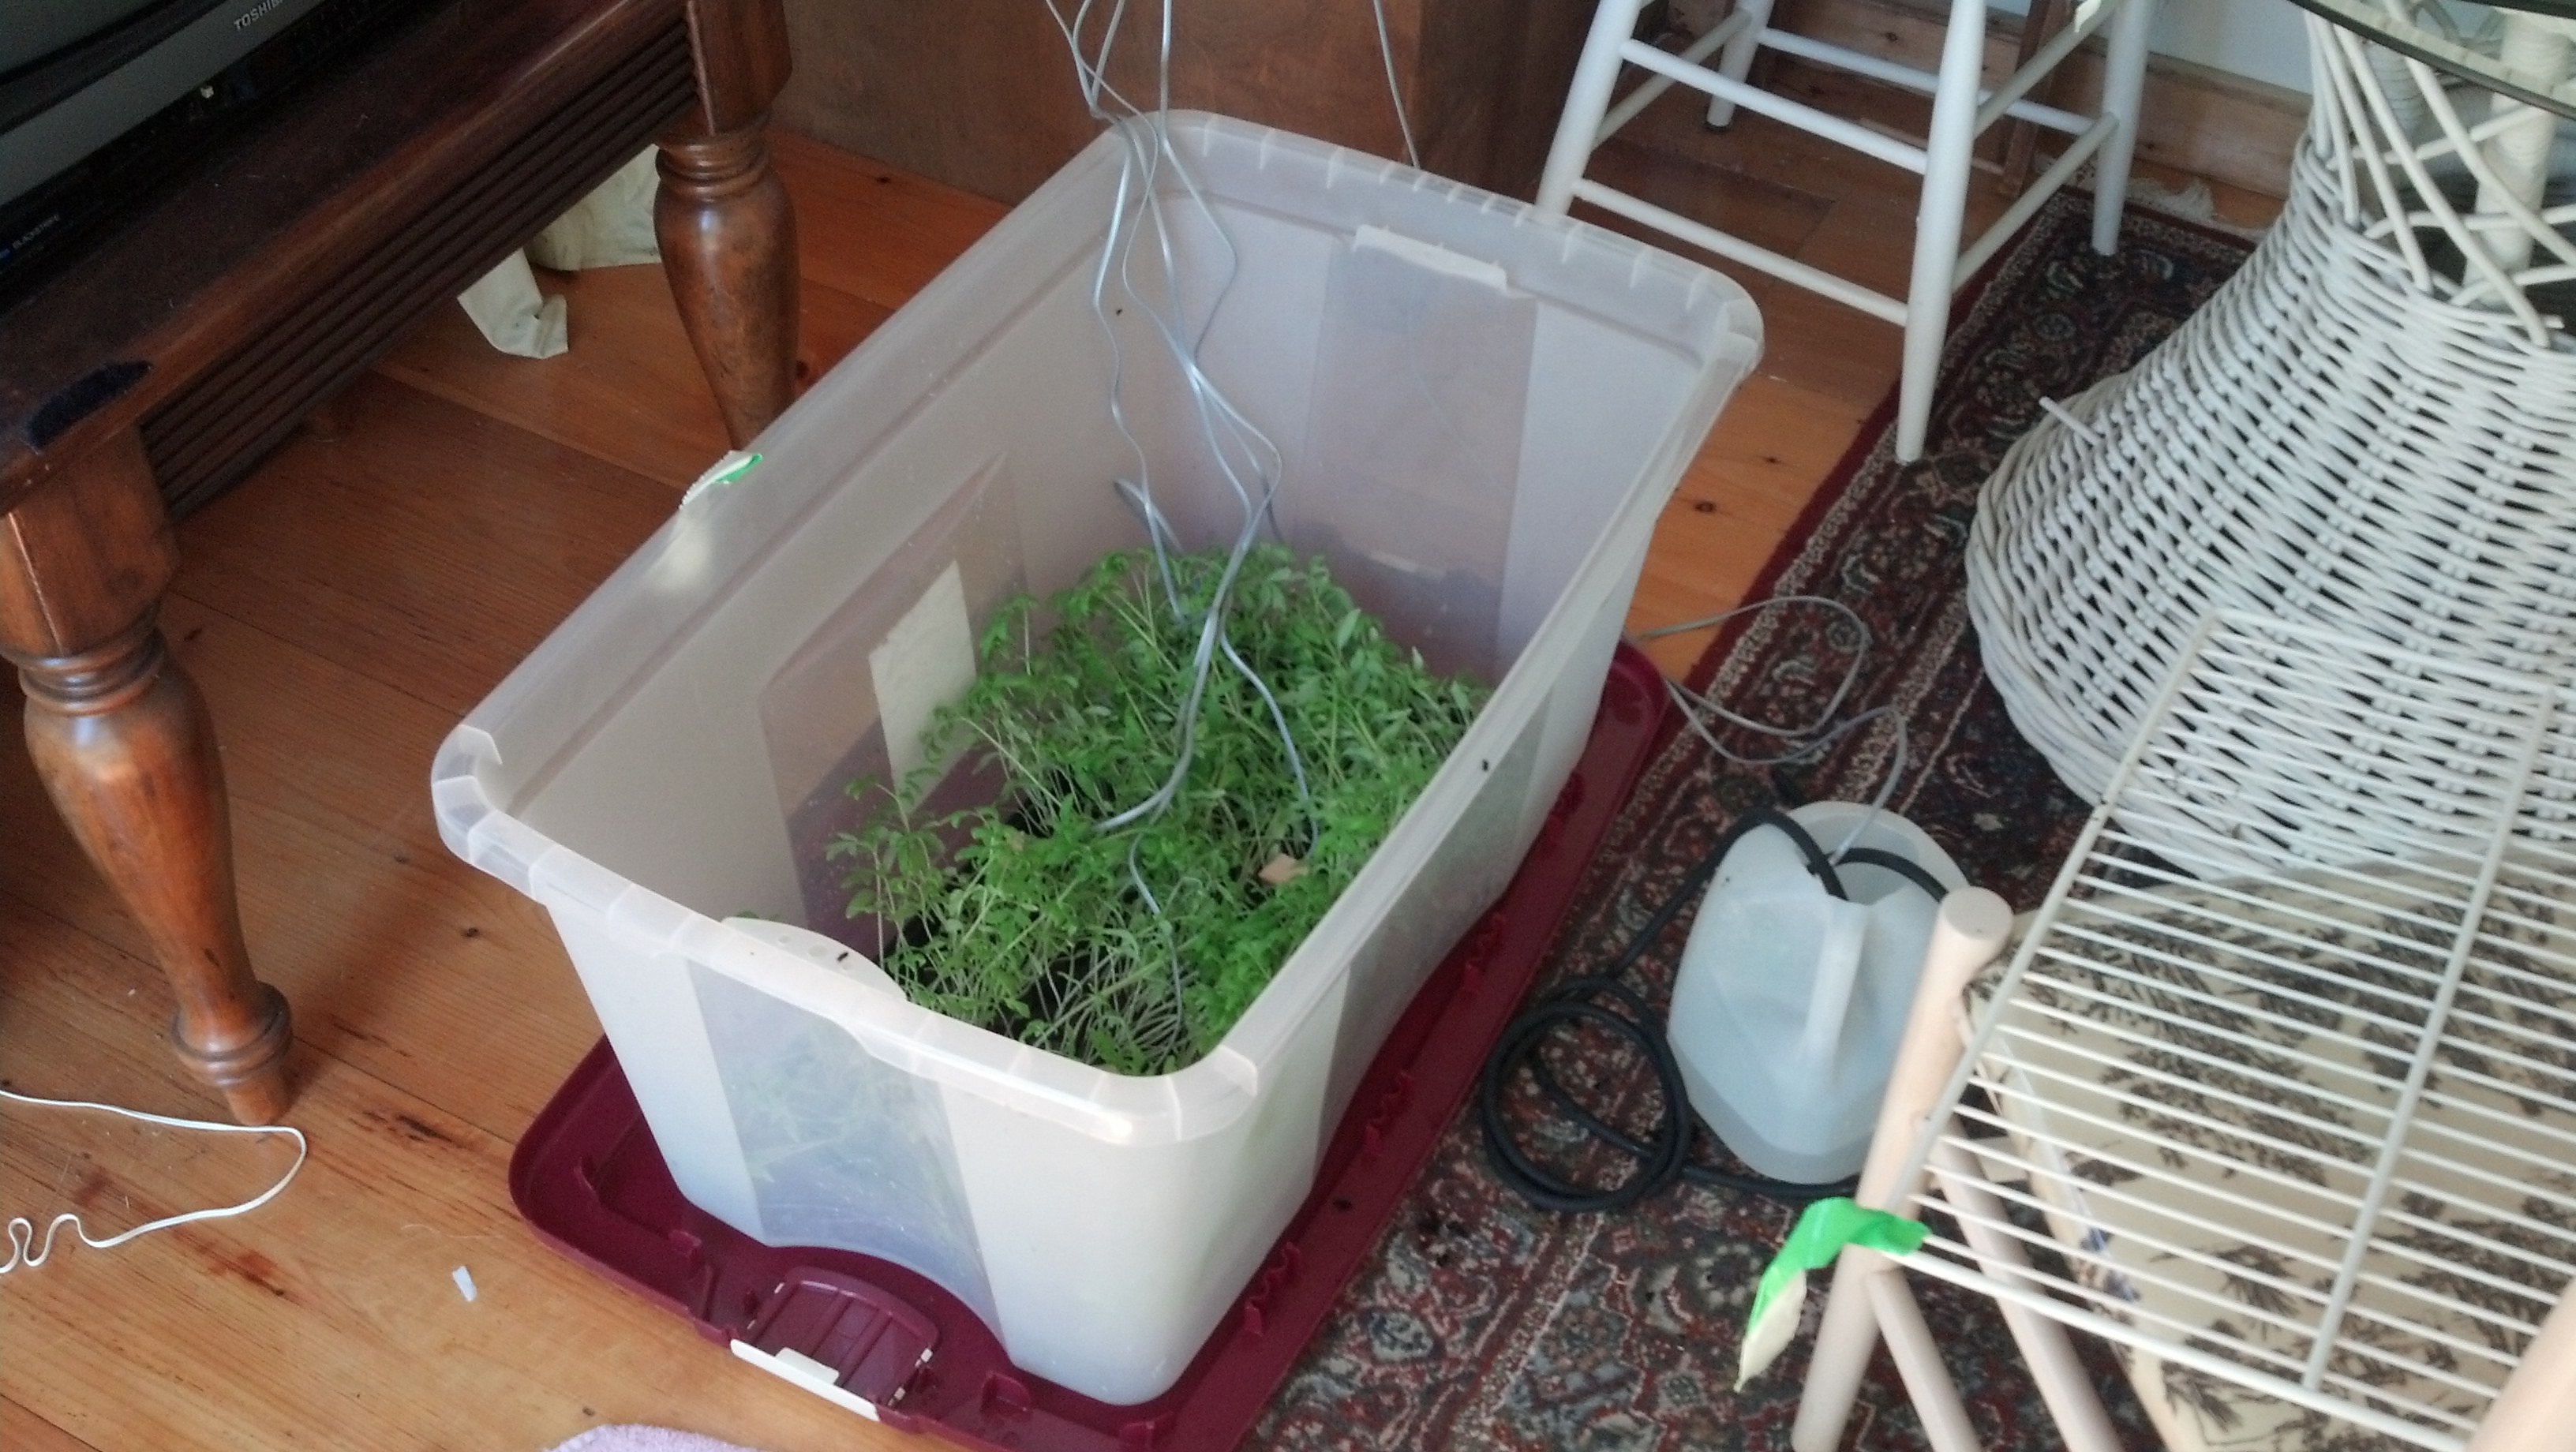
They’re hooked up to the ADC (mentioned later) in the same way that the LDR is, with a voltage dividing resistor, and then fed directly into ADC. The principal behind this sensor is that when you insert it into soil, the water in that soil connected the two probes, causing a voltage to flow across them. So if there is more water in the soil, more electrons will flow across them, and the analog value will be higher. It’s very basic, but it works. I’ve done several long term tests, and over time, as the soil becomes dryer, the value gets lower, indicating relative dryness. Here is a picture of the four probes in the soil, with the plants.
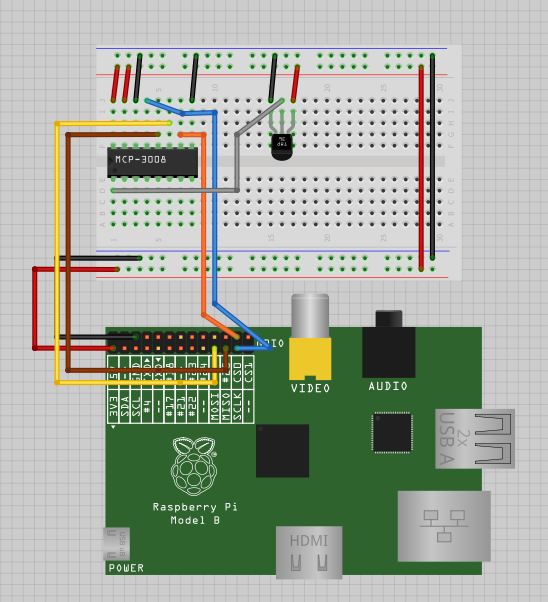
The TMP sensor’s output is plugged directly into the ADC and the LDR is very basically connected to the ADC as well, this is essentially how how the whole thing is setup on the breadboard:
The pump system is pretty dead simple. Essentially it is a PowerSwitch Tail II switching the mains to a 9v DC power supply. The 9v power supply is connected directly to a 12v DC submersible pump. Instead of using a motor driver chip, which requires 3 pins to do, and the chip would get hot and whatnot, I’ve decided to go with this method.
The pump is not self priming. This means it cannot make the transition from pumping air to pumping water. I wrestled with this problem for a long time, and came up with what I think is an elegant solution. I submerged the pump directly into the water, which means the pump will never fill with air, and will always pump water when activated. Here’s a video explaining the pump system:
The next system is the ADC connected to the Raspberry Pi. It is an 8 bit, 8 port analog to digital converter that can easily run on 3.3v so it’s perfect for the pi. Here is the chip, and you set it up as follows (I took this from an earlier post I wrote)
Now we need to set up the specific libraries for python the first of which being spidev, the spi tool for the raspberry pi which we can grab from git using the following commands:
|
1 2 3 4 5 |
sudo apt-get install git git clone git://github.com/doceme/py-spidev cd py-spidev/ sudo apt-get install python-dev sudo python setup.py install |
You also need to (copied from http://scruss.com/blog/2013/01/19/the-quite-rubbish-clock/):
As root, edit the kernel module blacklist file:
|
1 |
sudo vi /etc/modprobe.d/raspi-blacklist.conf |
Comment out the spi-bcm2708 line so it looks like this:
|
1 |
#blacklist spi-bcm2708 |
Save the file so that the module will load on future reboots. To enable the module now, enter:
|
1 |
sudo modprobe spi-bcm2708 |
To read from the ADC, add the following to your python code. The full code will be listed later:
|
1 2 3 4 5 6 7 8 |
#fuction that can read the adc def readadc(adcnum): # read SPI data from MCP3008 chip, 8 possible adc's (0 thru 7) if adcnum > 7 or adcnum < 0: return -1 r = spi.xfer2([1, 8 + adcnum << 4, 0]) adcout = ((r[1] & 3) << 8) + r[2] return adcout |
So just use “readadc(n)” to get a value.
I’ve made a real effort this time to comment my code well, so I’m not going to do a line by line breakdown like I often do, but I will clearly state the installs and setup things as follows. I’m assuming you have python-dev installed.
Download and install: APScheduler, this is a very straight forward install
Download and install: tweepy, you will need to go through the API setup process.
Download and install: flickrapi, you will need to go through the API setup process.
Here’s the source code for the python component of this project:
|
1 2 3 4 5 6 7 8 9 10 11 12 13 14 15 16 17 18 19 20 21 22 23 24 25 26 27 28 29 30 31 32 33 34 35 36 37 38 39 40 41 42 43 44 45 46 47 48 49 50 51 52 53 54 55 56 57 58 59 60 61 62 63 64 65 66 67 68 69 70 71 72 73 74 75 76 77 78 79 80 81 82 83 84 85 86 87 88 89 90 91 92 93 94 95 96 97 98 99 100 101 102 103 104 105 106 107 108 109 110 111 112 113 114 115 116 117 118 119 120 121 122 123 124 125 126 127 128 129 130 131 132 133 134 135 136 137 138 139 140 141 142 143 144 145 146 147 148 149 150 151 152 153 154 155 156 157 158 159 160 161 162 163 164 165 166 167 168 169 170 171 172 173 174 175 176 177 178 179 180 181 182 183 184 185 |
#Timing setup from datetime import datetime from apscheduler.scheduler import Scheduler import time import datetime import sys import os now =datetime.datetime.now() #import logging #if you start getting logging errors, uncomment these two lines #logging.basicConfig() #GPIO setup import RPi.GPIO as GPIO GPIO.setmode(GPIO.BOARD) GPIO.cleanup() pin = 26 #pin for the adc GPIO.setup(pin, GPIO.OUT) NPNtrans = 3 #the pin for the npn transistor GPIO.setup(NPNtrans, GPIO.OUT) sampleLED = 5 #the indicator LED GPIO.setup(sampleLED, GPIO.OUT) pump = 7 #pin for the pump GPIO.setup(pump, GPIO.OUT) #the adc's SPI setup import spidev spi = spidev.SpiDev() spi.open(0, 0) #sets up the program's ability to write to a mysql database import MySQLdb con = MySQLdb.connect('localhost','piplanter_user','piplanter_pass','piplanter'); cursor = con.cursor() #tweepy setup, you must use the keys given to you when you create your app import tweepy consumer_key="" consumer_secret="" access_token="" access_token_secret="" #"logs in" to twitter, auth = tweepy.OAuthHandler(consumer_key, consumer_secret) auth.set_access_token(access_token, access_token_secret) api = tweepy.API(auth) #Flickr Setup import flickrapi api_key = '' api_secret = '' flickr = flickrapi.FlickrAPI(api_key, api_secret, format='json') (token, frob) = flickr.get_token_part_one(perms='write') if not token: raw_input("Press ENTER after you authorized this program") flickr.get_token_part_two((token, frob)) #Variable Setup ontime = 20 #fuction that can read the adc def readadc(adcnum): # read SPI data from MCP3008 chip, 8 possible adc's (0 thru 7) if adcnum > 7 or adcnum < 0: return -1 r = spi.xfer2([1, 8 + adcnum << 4, 0]) adcout = ((r[1] & 3) << 8) + r[2] return adcout def slowSample(): date0 = "21-06-2013 15" date1 = "25-06-2013 12" date2 = "29-06-2013 12" date3 = "04-07-2013 12" date4 = "06-07-2013 12" if str(time.strftime('%d-%m-%Y %H')) == date0: water() if str(time.strftime('%d-%m-%Y %H')) == date1: water() if str(time.strftime('%d-%m-%Y %H')) == date2: water() if str(time.strftime('%d-%m-%Y %H')) == date3: water() if str(time.strftime('%d-%m-%Y %H')) == date4: water() print "----------start----------" GPIO.output(NPNtrans, True) GPIO.output(sampleLED, True) time.sleep(1) sampleTime = time.ctime() mst1 = readadc(0) mst2 = readadc(1) mst3 = readadc(2) mst4 = readadc(3) pot1 = readadc(4) ldr1 = readadc(5) millivolts = readadc(6)*(3300.0/1024.0) temp_c = ((millivolts - 100.0)/10)-40.0 tmp1 = (temp_c * 9.0 / 5.0) + 32 #prints debug info to console print sampleTime,"|","MST1:",mst1,"MST2:",mst2,"MST3:",mst3,"MST4:",mst4,"Pot1:",pot1,"LDR1:",ldr1,"TMP1:",tmp1 #prints the debug info #adds the data to the mysql table cursor.execute("INSERT INTO piplanter_table_17(Time,mst1_V,mst2_V,mst3_V,mst4_V,pot1_V,ldr1_V,tmp1_F) VALUES(%s,%s,%s,%s,%s,%s,%s,%s)",(sampleTime,mst1,mst2,mst3,mst4,pot1,ldr1,tmp1)) con.commit() #this is important for live updating GPIO.output(NPNtrans, False) #turns the probes off #renders the image of the graph print "render start" os.system("php /opt/bitnami/wordpress/piplanter/renderScript.php") #renders the .png file print "render complete" #finds the newest image in the directory allfiles = sorted(os.listdir('/opt/bitnami/wordpress/piplanter/renders/'), key=lambda p: os.path.getctime(os.path.join('/opt/bitnami/wordpress/piplanter/renders/', p))) newest = '/opt/bitnami/wordpress/piplanter/renders/'+allfiles[-1] print 'File for upload: ' + newest #prints location and file to console response = flickr.upload(filename=newest, title=sampleTime, format='etree') #uploads the file to flickr photoID = response.find('photoid').text #gets the id of the photo for constructing a url print 'Upload Successful, Photo ID: ' + photoID #more debug info #tweets the image and data send = 'Brghtnss: ' + str(format((((float(ldr1)/1024)*100)),'.0f')) + '% / ' + 'Tmprtr: ' + str(format(tmp1,'.0f')) + ' Dg F' + ' / Avg Plnt Moisture: '+ str(format(float((float((mst1+mst2+mst3+mst4)/4)/1024)*100),'.0f')) + '%' + ' Graph: ' +'http://www.flickr.com/photos/97350286@N08/'+photoID +' - www.esologic.com/?p=643' #builds the text of the tweet print "Tweeting:" , send #for debug purposes api.update_status(send) #tweets the tweet time.sleep(.1) GPIO.output(sampleLED, False) print "-----------end-----------" def water(): print "===== Starting Watering Process =====" GPIO.output(NPNtrans, True) GPIO.output(sampleLED, True) time.sleep(1) sensor1_before = readadc(0) sensor2_before = readadc(1) sensor3_before = readadc(2) sensor4_before = readadc(3) before = "WATERING START / Moisture Before - " + "Sensor 1:" + str(sensor1_before) + " Sensor 2:" + str(sensor2_before) + " Sensor 3:" + str(sensor3_before) + " Sensor 4:" + str(sensor4_before) + " - Average:" + str((float(sensor1_before+sensor2_before+sensor3_before+sensor4_before)/4)) api.update_status(before) print before GPIO.output(pump, True) time.sleep(ontime) GPIO.output(pump, False) time.sleep(60) #gives the water time to penetrate the soil sensor1_after = readadc(0) sensor2_after = readadc(1) sensor3_after = readadc(2) sensor4_after = readadc(3) after = "WATERING COMPLETED / Moisture After - " + "Sensor 1:" + str(sensor1_after) + " Sensor 2:" + str(sensor2_after) + " Sensor 3:" + str(sensor3_after) + " Sensor 4:" + str(sensor4_after) + " - Average: " + str((float(sensor1_after+sensor2_after+sensor3_after+sensor4_after)/4)) api.update_status(after) print after GPIO.output(NPNtrans, False) GPIO.output(sampleLED, False) print "====== Watering Process Complete =====" #water() slowSample() #runs the sample once before the interval starts, mostly a debug function scheduler = Scheduler(standalone=True) scheduler.add_interval_job(slowSample, hours=1) scheduler.start() #runs the program indefianately once every hour |
There you go! Essentially, every hour, the raspberry pi samples data from 4 humidity probes, an LDR and a tmp sensor. Once the sampling is complete, it dumps the data into a mysql database. From there the data is rendered into a graph using pChart in the form of a .png image. From there, that .png files is uploaded to flickr using this api. Once the file is uploaded, it returns it’s photo ID to the python script. From there, a tweet is built containing the brightness at the time of the tweet, the temperature at the time of the tweet, and the average moisture of the plants. It also uses the photo ID from flickr obtained earlier to build a URL leading to that image on flickr which it tweets as well. The final part of the tweet is a url that leads to this post! (taken from)
The database is extremely simple, after installing MySQL set it up and create table that follows this syntax:
|
1 |
CREATE TABLE piplanter_table_17(Sample_Number INT NOT NULL AUTO_INCREMENT PRIMARY KEY, Time VARCHAR(100), mst1_V VARCHAR(100), mst2_V VARCHAR(100), mst3_V VARCHAR(100), mst4_V VARCHAR(100), pot1_V VARCHAR(100), ldr1_V VARCHAR(100), tmp1_F VARCHAR(100) ); |
Pretty basic stuff, the table is just where the python script dumps the data every hour.
The software driving the graphing part of the project is a bit of php graphing software called pchart. It allows me to graph mysql values from a table in a variety of ways. It is very important, and the code for the php script is as follows:
|
1 2 3 4 5 6 7 8 9 10 11 12 13 14 15 16 17 18 19 20 21 22 23 24 25 26 27 28 29 30 31 32 33 34 35 36 37 38 39 40 41 42 43 44 45 46 47 48 49 50 51 52 53 54 55 56 57 58 59 60 61 62 63 64 65 66 67 68 69 70 71 72 73 74 75 76 77 78 79 80 81 82 83 84 85 86 |
<?php /* Include all the classes */ include("/srv/www/lib/pChart/class/pData.class.php"); include("/srv/www/lib/pChart/class/pDraw.class.php"); include("/srv/www/lib/pChart/class/pImage.class.php"); $myData = new pData(); /* Create your dataset object */ $db = mysql_connect("localhost", "user", "pass"); //location of server, db username, db pass mysql_select_db("piplanter", $db); $Requete = "SELECT * FROM `piplanter_table_17`"; //table name $Result = mysql_query($Requete, $db); /*This fetches the data from the mysql database, and adds it to pchart as points*/ while($row = mysql_fetch_array($Result)) { $Time = $row["Time"]; $myData->addPoints($Time,"Time"); $mst1_V = $row["mst1_V"]; $myData->addPoints($mst1_V,"mst1_V"); $mst2_V = $row["mst2_V"]; $myData->addPoints($mst2_V,"mst2_V"); $mst3_V = $row["mst3_V"]; $myData->addPoints($mst3_V,"mst3_V"); $mst4_V = $row["mst4_V"]; $myData->addPoints($mst4_V,"mst4_V"); $ldr1_V = $row["ldr1_V"]; $myData->addPoints($ldr1_V,"ldr1_V"); $tmp1_F = $row["tmp1_F"]; $myData->addPoints($tmp1_F,"tmp1_F"); } $myData-> setSerieOnAxis("tmp1_F", 0); //assigns the data to the frist axis $myData-> setAxisName(0, "Degrees F"); //adds the label to the first axis $myData-> setSerieOnAxis("ldr1_V", 1); $myData-> setAxisName(1, "LDR"); $myData-> setSerieOnAxis("mst1_V", 2); $myData-> setSerieWeight("mst1_V",2); $myData-> setSerieOnAxis("mst2_V", 2); $myData-> setSerieOnAxis("mst3_V", 2); $myData-> setSerieOnAxis("mst4_V", 2); $myData-> setAxisName(2, "Relative Moisture"); $myData->setAbscissa("Time"); //sets the time data set as the x axis label $myData-> setSerieWeight("mst1_V",1); //draws the line tickness $myData->setPalette("mst1_V",array("R"=>58,"G"=>95,"B"=>205,"Alpha"=>80)); //sets the line color $myData-> setSerieWeight("mst2_V",1); $myData->setPalette("mst2_V",array("R"=>39,"G"=>64,"B"=>139,"Alpha"=>80)); $myData-> setSerieWeight("mst3_V",1); $myData->setPalette("mst3_V",array("R"=>0,"G"=>34,"B"=>102,"Alpha"=>80)); $myData-> setSerieWeight("mst4_V",1); $myData->setPalette("mst4_V",array("R"=>67,"G"=>110,"B"=>238,"Alpha"=>80)); $myData-> setSerieWeight("ldr1_V",2); $myData-> setSerieTicks("ldr1_V", 4); $myData-> setSerieWeight("tmp1_F",2); $myData-> setSerieTicks("tmp1_F", 4); $myPicture = new pImage(2000,500,$myData); /* Create a pChart object and associate your dataset */ $myPicture->setFontProperties(array("FontName"=>"/srv/www/lib/pChart/fonts/pf_arma_five.ttf","FontSize"=>6)); /* Choose a nice font */ $myPicture->setGraphArea(130,40,1900,300); /* Define the boundaries of the graph area */ $myPicture->drawScale(array("LabelRotation"=>320)); /* Draw the scale, keep everything automatic */ $Settings = array("R"=>250, "G"=>250, "B"=>250, "Dash"=>1, "DashR"=>0, "DashG"=>0, "DashB"=>0); /*The combination makes a cool looking graph*/ $myPicture->drawPlotChart(); $myPicture->drawLineChart(); $myPicture->drawLegend(30,320); //adds the legend //$date-> date("d-M-Y:H:i:s"); //$myPicture->autoOutput(); /* Build the PNG file and send it to the web browser */ $myPicture->render("/opt/bitnami/wordpress/piplanter/renders/".date("d-M-Y_H:i:s").".png"); ?> |
As you may be able to guess, upon the calling of this script, the program looks for a table called “piplanter_table_17” and does a bunch of stuff as commented to produce a graph. This is what a sample graph looks like:
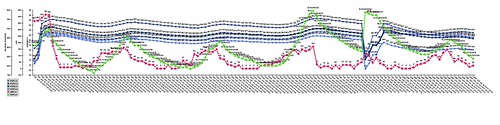
This is data taken over 6 days, and it’s a lot to look at, but it’s good stuff.
As you hopefully derived from the python code, this project uses Twitter to send data to me. Instead of using an email server or sending sms messages, I decided on twitter because of a few reasons. I use the service constantly, so I won’t ever miss a tweet. The API seemed really easy to use (and it was!) and allowed more than one person to acess the data at any one time. I decided to use flickr as my image hosting service for a lot of the same reasons, but the main one was their 1TB storage per person. You’ve already seen a sample flickr upload, so here’s a sample tweet:
Brghtnss: 2% / Tmprtr: 71 Dg F / Avg Plnt Moisture: 33% Graph: http://t.co/hBuyNQkE7H – http://t.co/H2p1UJx59w
— eso’s rpi (@eso_rpi) June 27, 2013
That’s essentially it! Thank you for reading, and please ask questions.
Last night I finished the majority of the software for this project. Here’s a video of me going over what happened and what the program does in simpler terms:
Essentially, every hour, the raspberry pi samples data from 4 humidity probes, an LDR and a tmp sensor. Once the sampling is complete, it dumps the data into a mysql database. From there the data is rendered into a graph using pChart in the form of a .png image. From there, that .png files is uploaded to flickr using this api. Once the file is uploaded, it returns it’s photo ID to the python script. From there, a tweet is built containing the brightness at the time of the tweet, the temperature at the time of the tweet, and the average moisture of the plants. It also uses the photo ID from flickr obtained earlier to build a URL leading to that image on flickr which it tweets as well. The final part of the tweet is a url that leads to this post!
That was a lot of explanation, but this program does quite a bit. The source comes in two parts, here’s the python script that handles the brunt of the processing. You will need a bunch of libraries to run this, you could pick through past posts of mine to find what those are, but when I do a final post for this project I will include all of those.
|
1 2 3 4 5 6 7 8 9 10 11 12 13 14 15 16 17 18 19 20 21 22 23 24 25 26 27 28 29 30 31 32 33 34 35 36 37 38 39 40 41 42 43 44 45 46 47 48 49 50 51 52 53 54 55 56 57 58 59 60 61 62 63 64 65 66 67 68 69 70 71 72 73 74 75 76 77 78 79 80 81 82 83 84 85 86 87 88 89 90 91 92 93 94 95 96 97 98 99 100 101 102 103 104 105 106 107 108 109 110 111 112 113 114 115 116 117 118 119 120 121 122 123 124 125 126 127 |
#Timing setup from datetime import datetime from apscheduler.scheduler import Scheduler import time import datetime import sys import os now =datetime.datetime.now() import logging #if you start getting logging errors, uncomment these two lines logging.basicConfig() #GPIO setup import RPi.GPIO as GPIO GPIO.setmode(GPIO.BOARD) GPIO.cleanup() pin = 26 #pin for the adc GPIO.setup(pin, GPIO.OUT) NPNtrans = 3 #the pin for the npn transistor GPIO.setup(NPNtrans, GPIO.OUT) sampleLED = 5 #the indicator LED GPIO.setup(sampleLED, GPIO.OUT) #the adc's SPI setup import spidev spi = spidev.SpiDev() spi.open(0, 0) #sets up the program's ability to write to a mysql database import MySQLdb con = MySQLdb.connect('localhost','piplanter_user','piplanter_pass','piplanter'); cursor = con.cursor() #tweepy setup, you must use the keys given to you when you create your app import tweepy consumer_key="" consumer_secret="" access_token="" access_token_secret="" #"logs in" to twitter, auth = tweepy.OAuthHandler(consumer_key, consumer_secret) auth.set_access_token(access_token, access_token_secret) api = tweepy.API(auth) import flickrapi #import xml.etree.ElementTree as ET api_key = '' api_secret = '' flickr = flickrapi.FlickrAPI(api_key, api_secret, format='json') (token, frob) = flickr.get_token_part_one(perms='write') if not token: raw_input("Press ENTER after you authorized this program") flickr.get_token_part_two((token, frob)) #fuction that can read the adc def readadc(adcnum): # read SPI data from MCP3008 chip, 8 possible adc's (0 thru 7) if adcnum > 7 or adcnum < 0: return -1 r = spi.xfer2([1, 8 + adcnum << 4, 0]) adcout = ((r[1] & 3) << 8) + r[2] return adcout def slowSample(): GPIO.output(NPNtrans, True) GPIO.output(sampleLED, True) sampleTime =time.ctime() mst1 = readadc(0) mst2 = readadc(1) mst3 = readadc(2) mst4 = readadc(3) pot1 = readadc(4) ldr1 = readadc(5) millivolts = readadc(6)*(3300.0/1024.0) temp_c = ((millivolts - 100.0)/10)-40.0 tmp1 = (temp_c * 9.0 / 5.0) + 32 #prints debug info to console print sampleTime,"|","MST1:",mst1,"MST2:",mst2,"MST3:",mst3,"MST4:",mst4,"Pot1:",pot1,"LDR1:",ldr1,"TMP1:",tmp1 #prints the debug info #adds the data to the mysql table cursor.execute("INSERT INTO piplanter_table_15(Time,mst1_V,mst2_V,mst3_V,mst4_V,pot1_V,ldr1_V,tmp1_F) VALUES(%s,%s,%s,%s,%s,%s,%s,%s)",(sampleTime,mst1,mst2,mst3,mst4,pot1,ldr1,tmp1)) con.commit() #this is important for live updating GPIO.output(NPNtrans, False) #turns the probes off #renders the image of the graph print "render start" os.system("php /opt/bitnami/wordpress/piplanter/renderScript.php") #renders the .png file print "render complete" #finds the newest image in the directory allfiles = sorted(os.listdir('/opt/bitnami/wordpress/piplanter/renders/'), key=lambda p: os.path.getctime(os.path.join('/opt/bitnami/wordpress/piplanter/renders/', p))) newest = '/opt/bitnami/wordpress/piplanter/renders/'+allfiles[-1] print 'File for upload: ' + newest #prints location and file to console response = flickr.upload(filename=newest, title=sampleTime, format='etree') #uploads the file to flickr photoID = response.find('photoid').text #gets the id of the photo for constructing a url print 'Upload Successful, Photo ID: ' + photoID #more debug info #tweets the image and data send = 'Brghtnss: ' + str(format((((float(ldr1)/1024)*100)),'.0f')) + '% / ' + 'Tmprtr: ' + str(format(tmp1,'.0f')) + ' Dg F' + ' / Avg Plnt Moisture: '+ str(format(float((float((mst1+mst2+mst3+mst4)/4)/1024)*100),'.0f')) + '%' + ' Graph: ' +'http://www.flickr.com/photos/97350286@N08/'+photoID +' - www.esologic.com/?p=643' #builds the text of the tweet print "Tweeting:" , send #for debug purposes api.update_status(send) #tweets the tweet time.sleep(.1) GPIO.output(sampleLED, False) slowSample() #runs the sample once before the interval starts, mostly a debug function scheduler = Scheduler(standalone=True) scheduler.add_interval_job(slowSample, hours=1) scheduler.start() #runs the program indefianately once every hour |
Here’s the .php script that renders the graph from the mysql data. It is called by the python script.
|
1 2 3 4 5 6 7 8 9 10 11 12 13 14 15 16 17 18 19 20 21 22 23 24 25 26 27 28 29 30 31 32 33 34 35 36 37 38 39 40 41 42 43 44 45 46 47 48 49 50 51 52 53 54 55 56 57 58 59 60 61 62 63 64 65 66 67 68 69 70 71 72 73 74 75 76 77 78 79 80 81 82 83 84 85 |
<?php /* Include all the classes */ include("/srv/www/lib/pChart/class/pData.class.php"); include("/srv/www/lib/pChart/class/pDraw.class.php"); include("/srv/www/lib/pChart/class/pImage.class.php"); $myData = new pData(); /* Create your dataset object */ $db = mysql_connect("localhost", "piplanter_user", "piplanter_pass"); //location of server, db username, db pass mysql_select_db("piplanter", $db); $Requete = "SELECT * FROM `piplanter_table_15`"; //table name $Result = mysql_query($Requete, $db); /*This fetches the data from the mysql database, and adds it to pchart as points*/ while($row = mysql_fetch_array($Result)) { $Time = $row["Time"]; $myData->addPoints($Time,"Time"); $mst1_V = $row["mst1_V"]; $myData->addPoints($mst1_V,"mst1_V"); $mst2_V = $row["mst2_V"]; $myData->addPoints($mst2_V,"mst2_V"); $mst3_V = $row["mst3_V"]; $myData->addPoints($mst3_V,"mst3_V"); $mst4_V = $row["mst4_V"]; $myData->addPoints($mst4_V,"mst4_V"); $ldr1_V = $row["ldr1_V"]; $myData->addPoints($ldr1_V,"ldr1_V"); $tmp1_F = $row["tmp1_F"]; $myData->addPoints($tmp1_F,"tmp1_F"); } $myData-> setSerieOnAxis("tmp1_F", 0); //assigns the data to the frist axis $myData-> setAxisName(0, "Degrees F"); //adds the label to the first axis $myData-> setSerieOnAxis("ldr1_V", 1); $myData-> setAxisName(1, "LDR"); $myData-> setSerieOnAxis("mst1_V", 2); $myData-> setSerieWeight("mst1_V",2); $myData-> setSerieOnAxis("mst2_V", 2); $myData-> setSerieOnAxis("mst3_V", 2); $myData-> setSerieOnAxis("mst4_V", 2); $myData-> setAxisName(2, "Relative Moisture"); $myData->setAbscissa("Time"); //sets the time data set as the x axis label $myData-> setSerieWeight("mst1_V",1); //draws the line tickness $myData->setPalette("mst1_V",array("R"=>58,"G"=>95,"B"=>205,"Alpha"=>80)); //sets the line color $myData-> setSerieWeight("mst2_V",1); $myData->setPalette("mst2_V",array("R"=>39,"G"=>64,"B"=>139,"Alpha"=>80)); $myData-> setSerieWeight("mst3_V",1); $myData->setPalette("mst3_V",array("R"=>0,"G"=>34,"B"=>102,"Alpha"=>80)); $myData-> setSerieWeight("mst4_V",1); $myData->setPalette("mst4_V",array("R"=>67,"G"=>110,"B"=>238,"Alpha"=>80)); $myData-> setSerieWeight("ldr1_V",2); $myData-> setSerieTicks("ldr1_V", 4); $myData-> setSerieWeight("tmp1_F",2); $myData-> setSerieTicks("tmp1_F", 4); $myPicture = new pImage(2000,500,$myData); /* Create a pChart object and associate your dataset */ $myPicture->setFontProperties(array("FontName"=>"/srv/www/lib/pChart/fonts/pf_arma_five.ttf","FontSize"=>6)); /* Choose a nice font */ $myPicture->setGraphArea(130,40,1900,300); /* Define the boundaries of the graph area */ $myPicture->drawScale(array("LabelRotation"=>320)); /* Draw the scale, keep everything automatic */ $Settings = array("R"=>250, "G"=>250, "B"=>250, "Dash"=>1, "DashR"=>0, "DashG"=>0, "DashB"=>0); /*The combination makes a cool looking graph*/ $myPicture->drawPlotChart(); $myPicture->drawLineChart(); $myPicture->drawLegend(30,320); //adds the legend //$date-> date("d-M-Y:H:i:s"); //$myPicture->autoOutput(); /* Build the PNG file and send it to the web browser */ $myPicture->render("/opt/bitnami/wordpress/piplanter/renders/".date("d-M-Y_H:i:s").".png"); ?> |
Thanks for reading!
It’s summer time and I just got a bunch of money for graduating so the next logical step is make a boom box.
I have already ordered the parts, so here’s my list and an explanation for each part:
Amp – This is the heart of the system. Essentially it’s a small amplifier that will run on 12v. According to the reviews it’s pretty loud. It will take a very standard 3.5mm audio input, or a dual channel analog signal which will be easy to build around.
Battery – Long time followers will know I have a pretty big charger that should be able handle charging this beast. It’s 12v, which is the amp runs on.
Speakers – I picked these mostly because if their compatibility with the amp, and their good reviews on amazon, and the fact that they come with a grill and mounting hardware.
Bluetooth Receiver – This is another “selling point” of the system. Users will play music over Bluetooth. It can be powered via 5v, and I have a spare switching regulator that I can use to power it.
Ammo Box Enclosure – This will house the project. It is big enough, and easy enough to cut into to mount the speakers into the side. It is also sealed, so getting sand in it won’t be that big of an issue for beach trips.
I’ll keep updating as parts come in.

So as I said in one of my previous posts, I am going to be collecting a lot of data over the next few weeks while the tomato plants grow. I will be doing this to determine when soil is “dry” and how temperature and light effect that process. For the last week I have been collecting data in the configuration seen in my last post and here is the graph it produced you can click to see the full image:

This graph proves a few things. The first thing is that the relative moisture sensor works. As one can intuitively understand, if you don’t add more water into the system, nature will remove water via evaporation. The overall trend of the blue line (the rel mst sensor) is downward, backing up this point.
The problem with this setup was that I was spitting the voltage across the two probes constantly, which along with the water caused the nails to rapidly oxidize, which is something I would like to avoid in the long term. This also may have seriously corrupted the data so besides general trends, this whole set is unusable.
This isn’t necessarily a bad thing though, as I wanted to conduct a second trial with more probes and more dirt.
I decided to go with 4 probes, and here are a few pictures of the assembly process. Assembly process is the same, I just did it at my school:
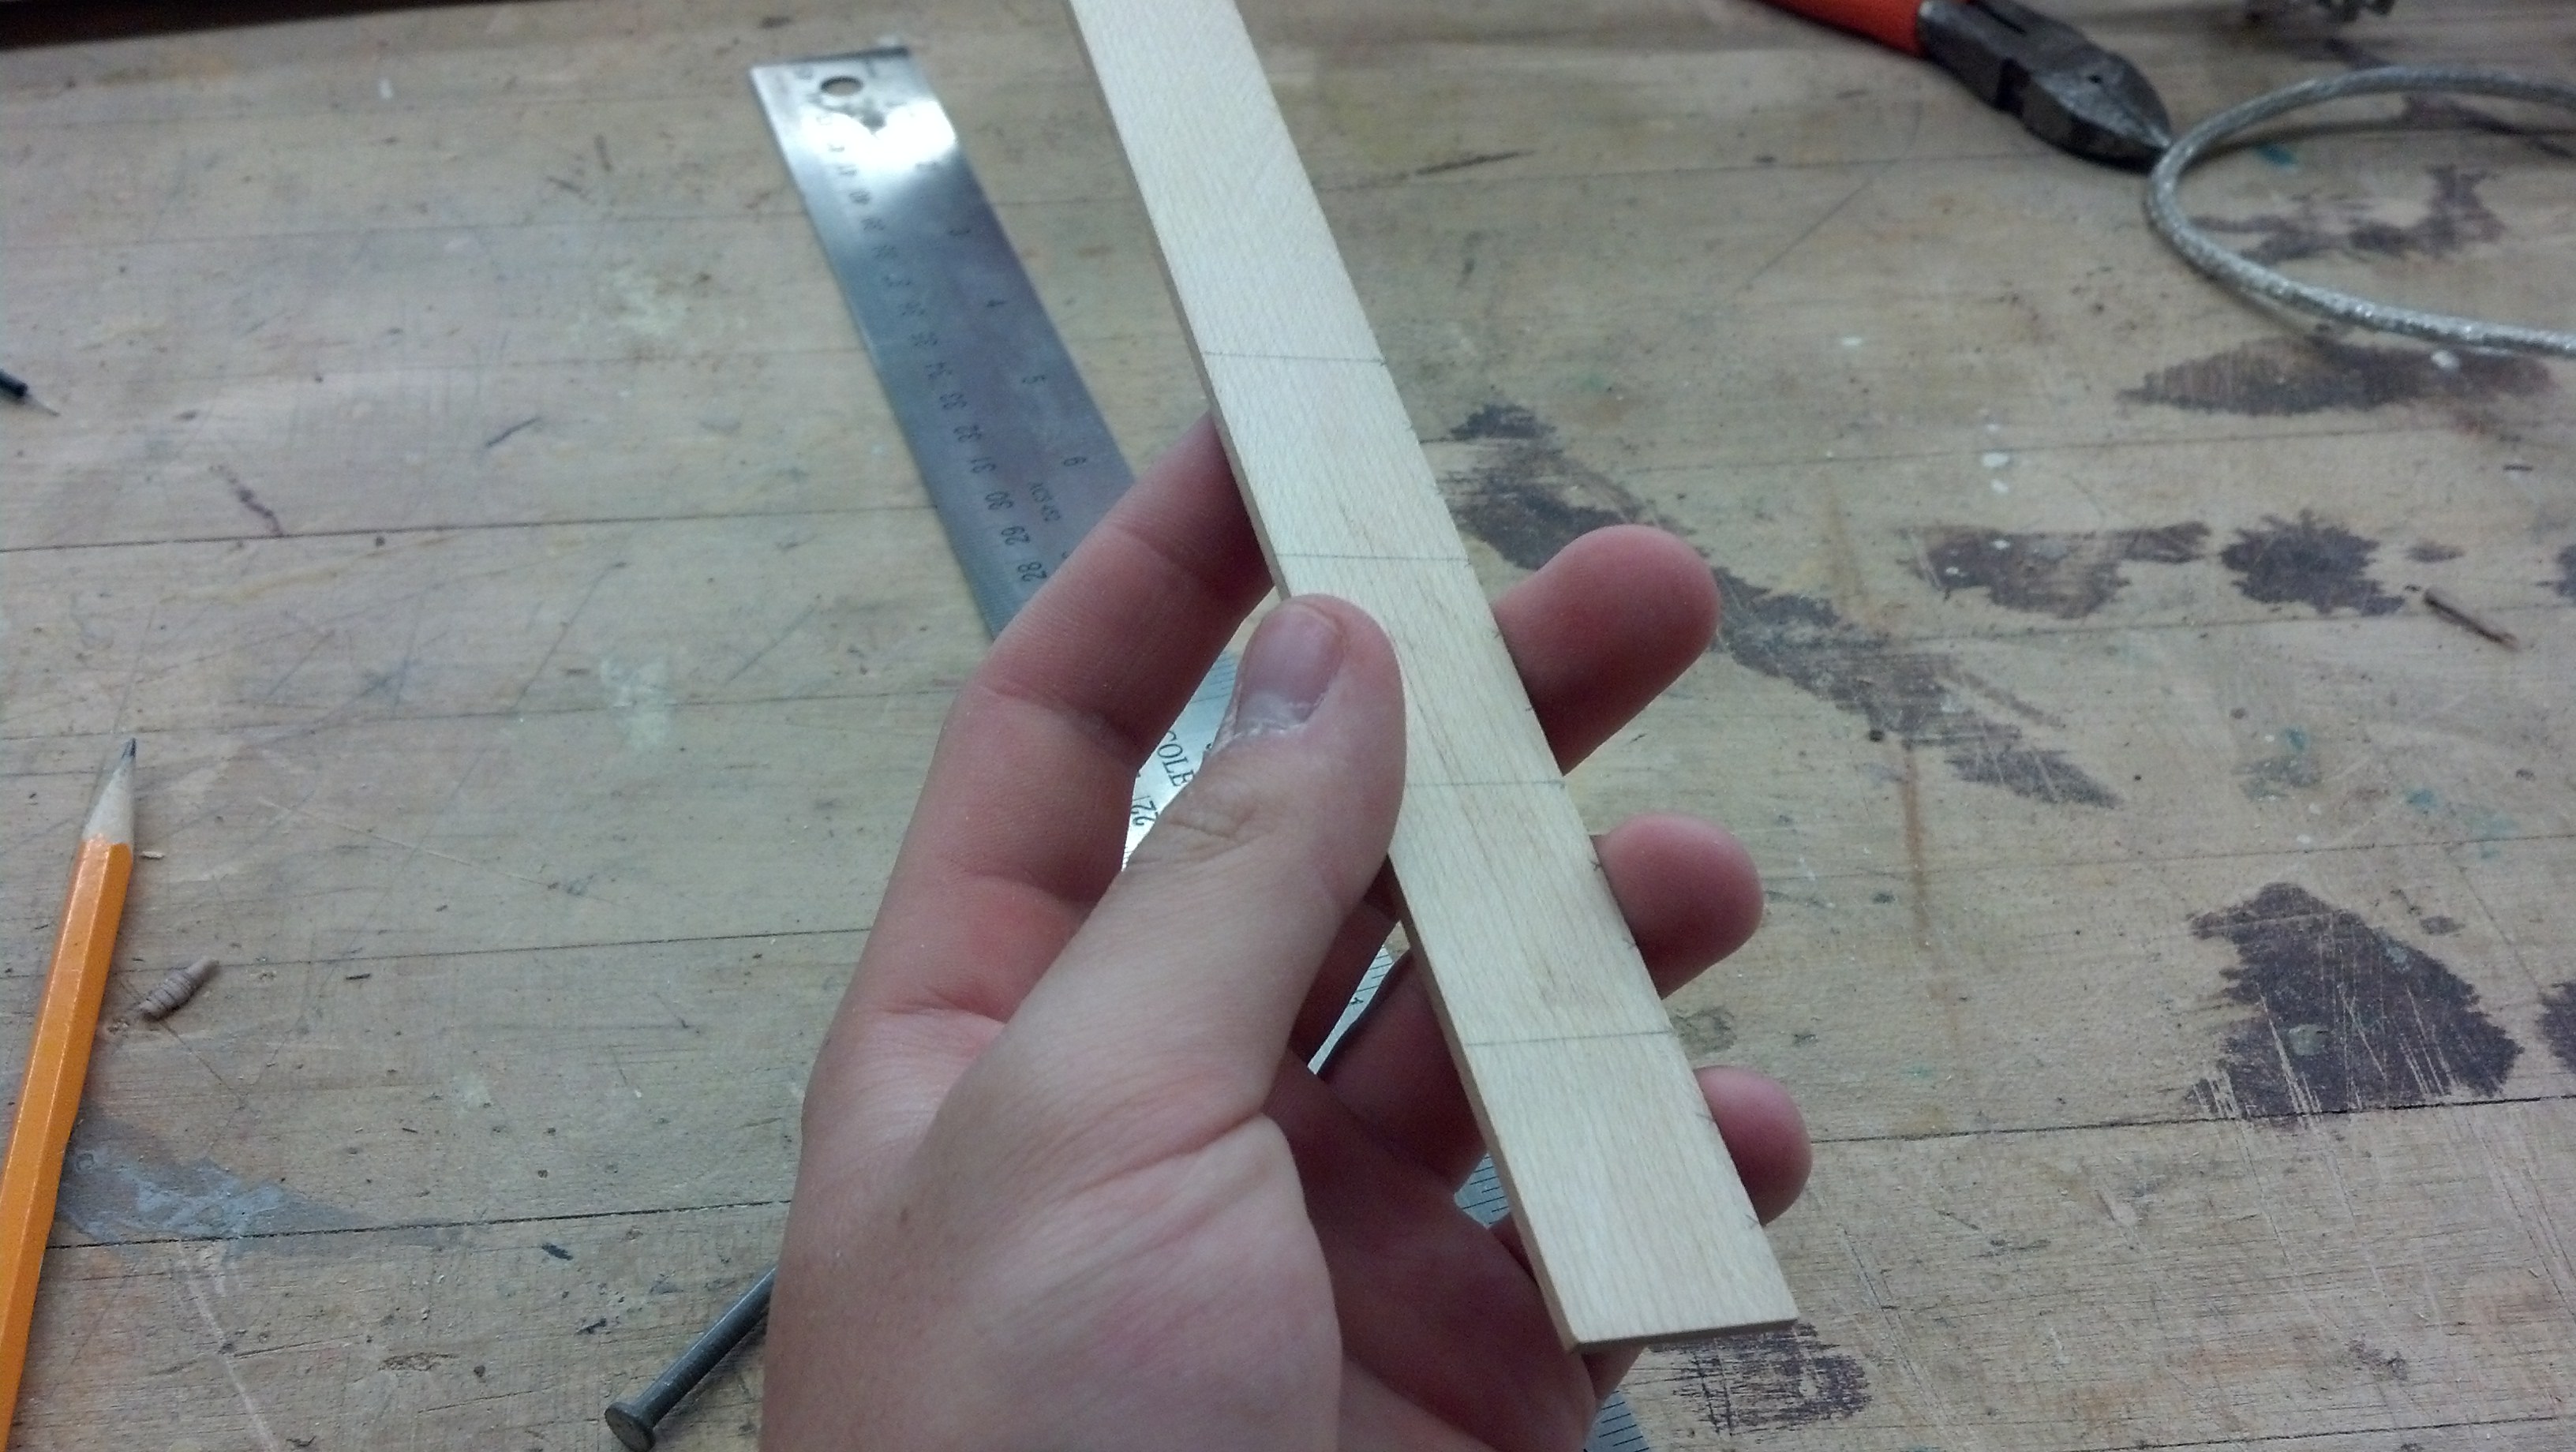
I cut it into 3cm sections and then drilled holes on the midpoints of the 2nd and 3rd cm as seen in a photo below.
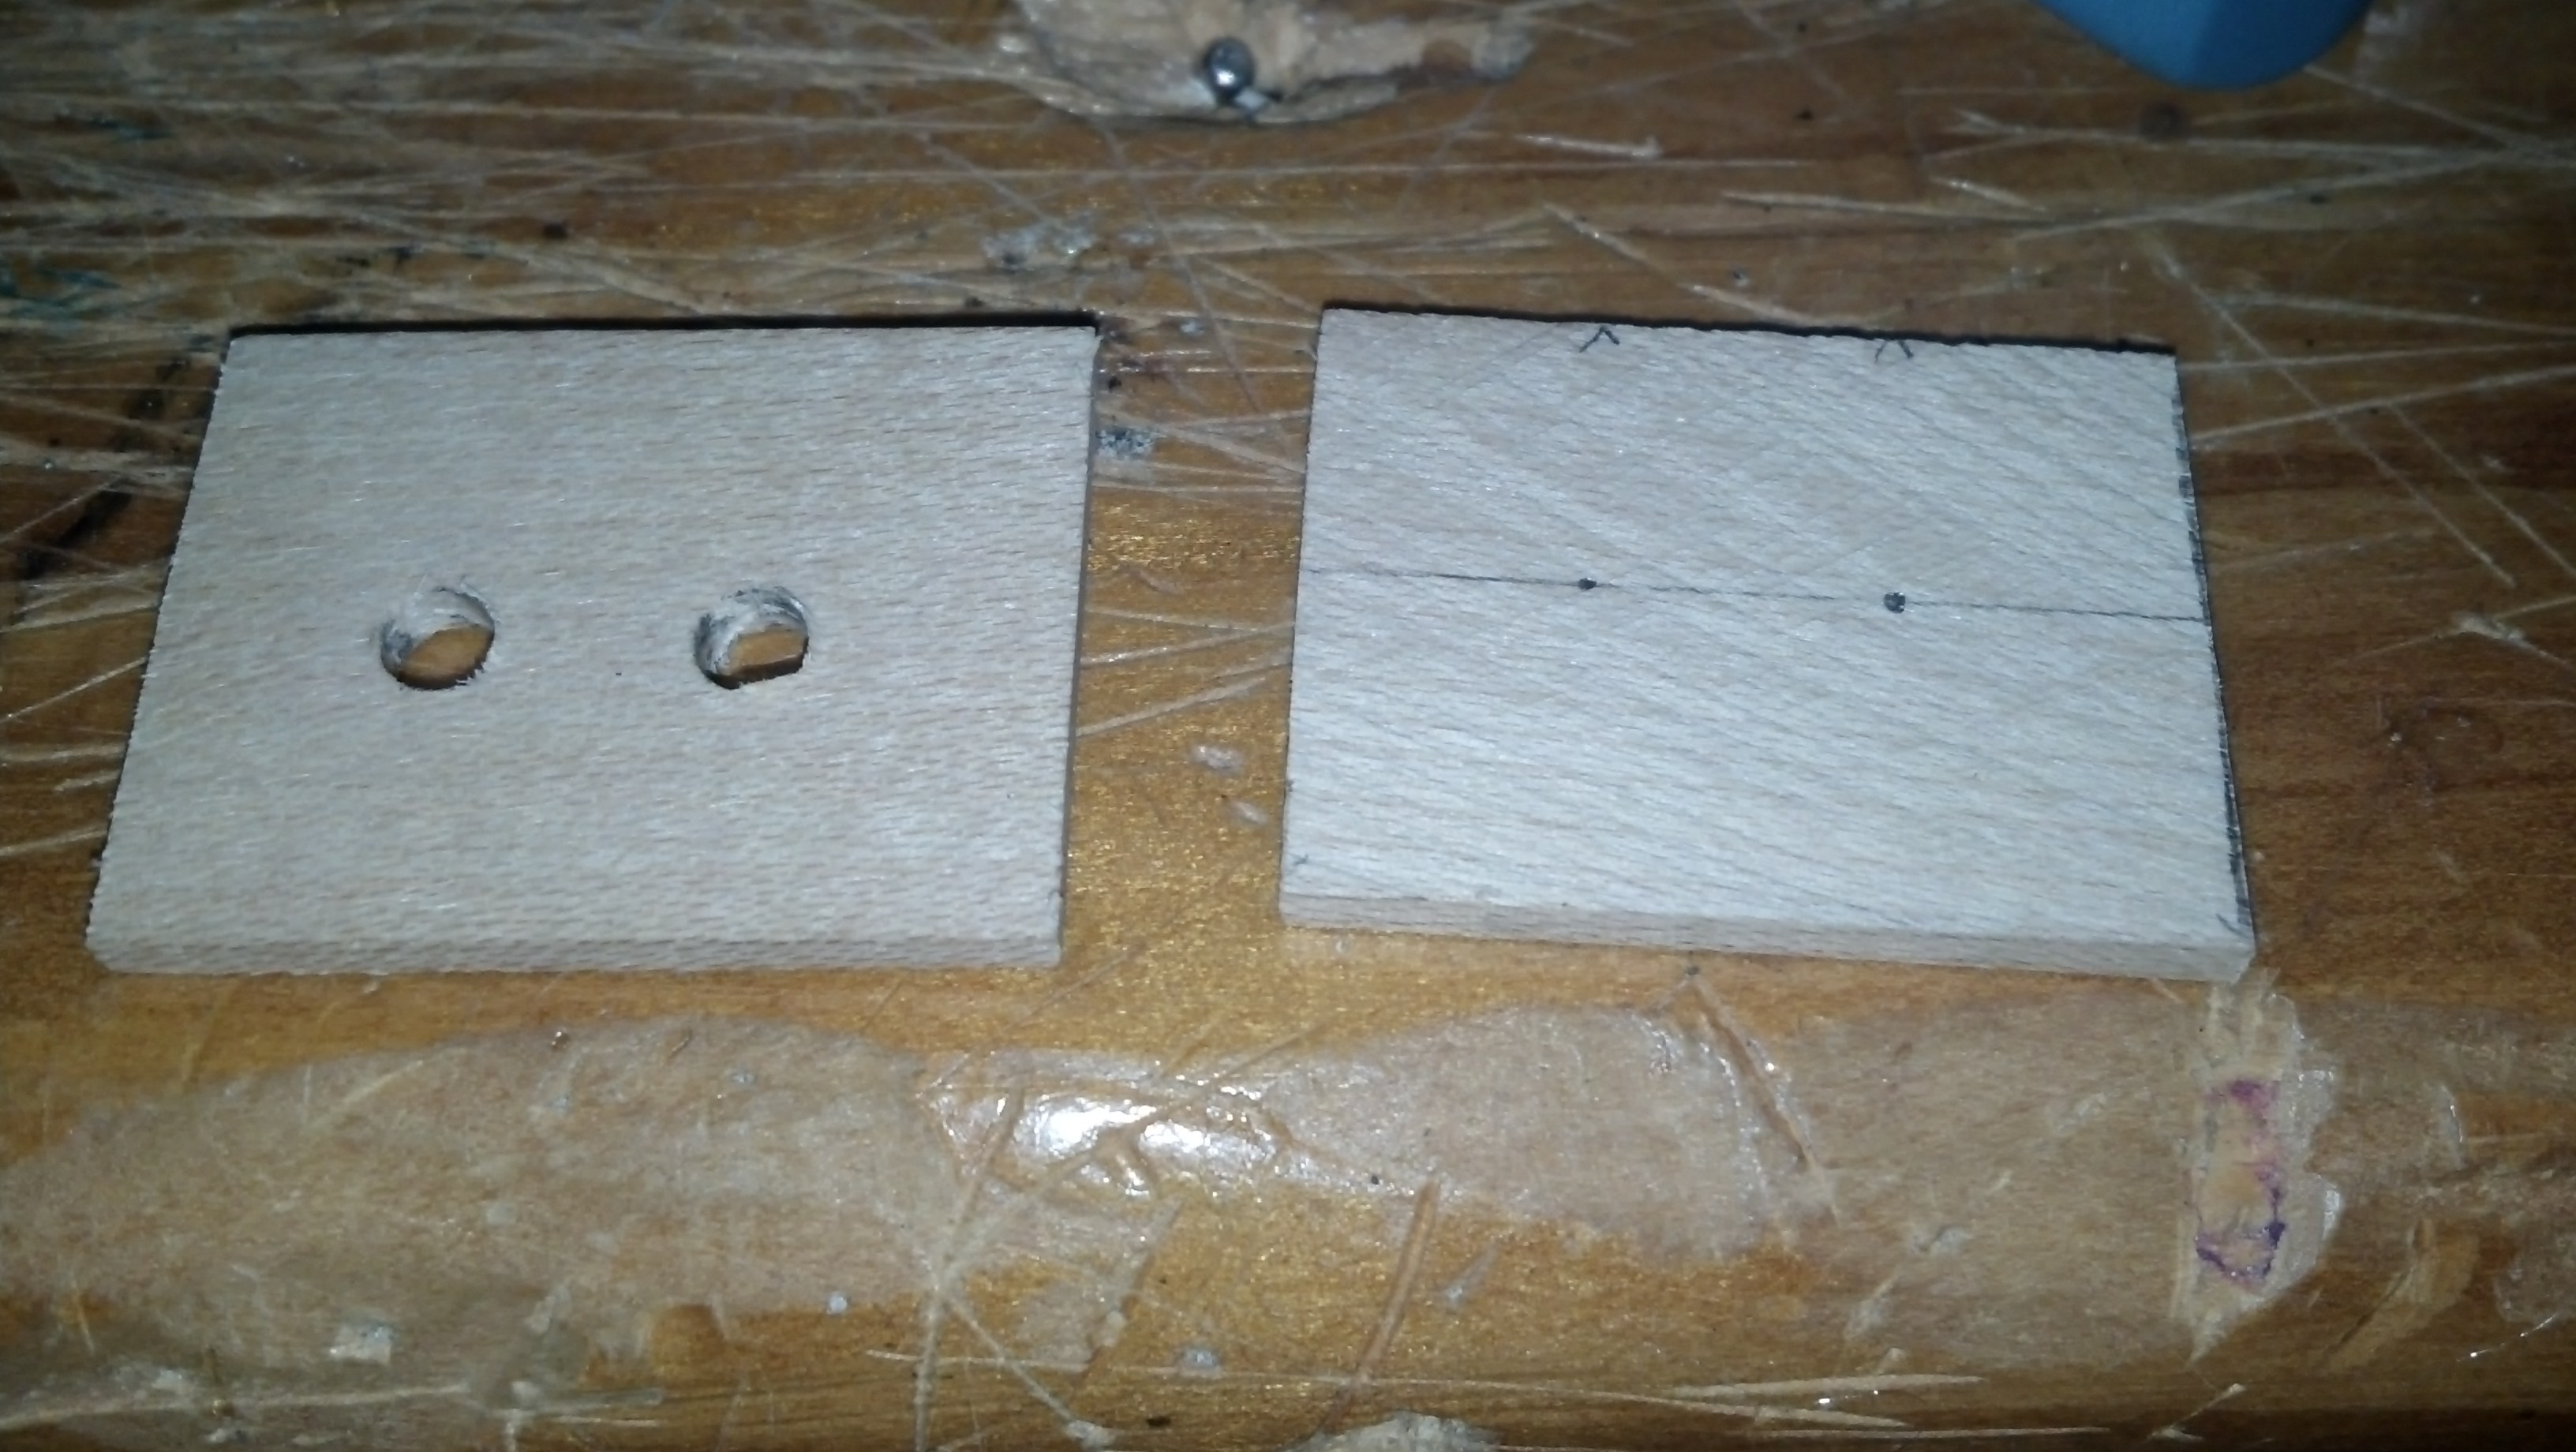
Here are the holes drilled for the nails

Here are the nails inserted into all 4
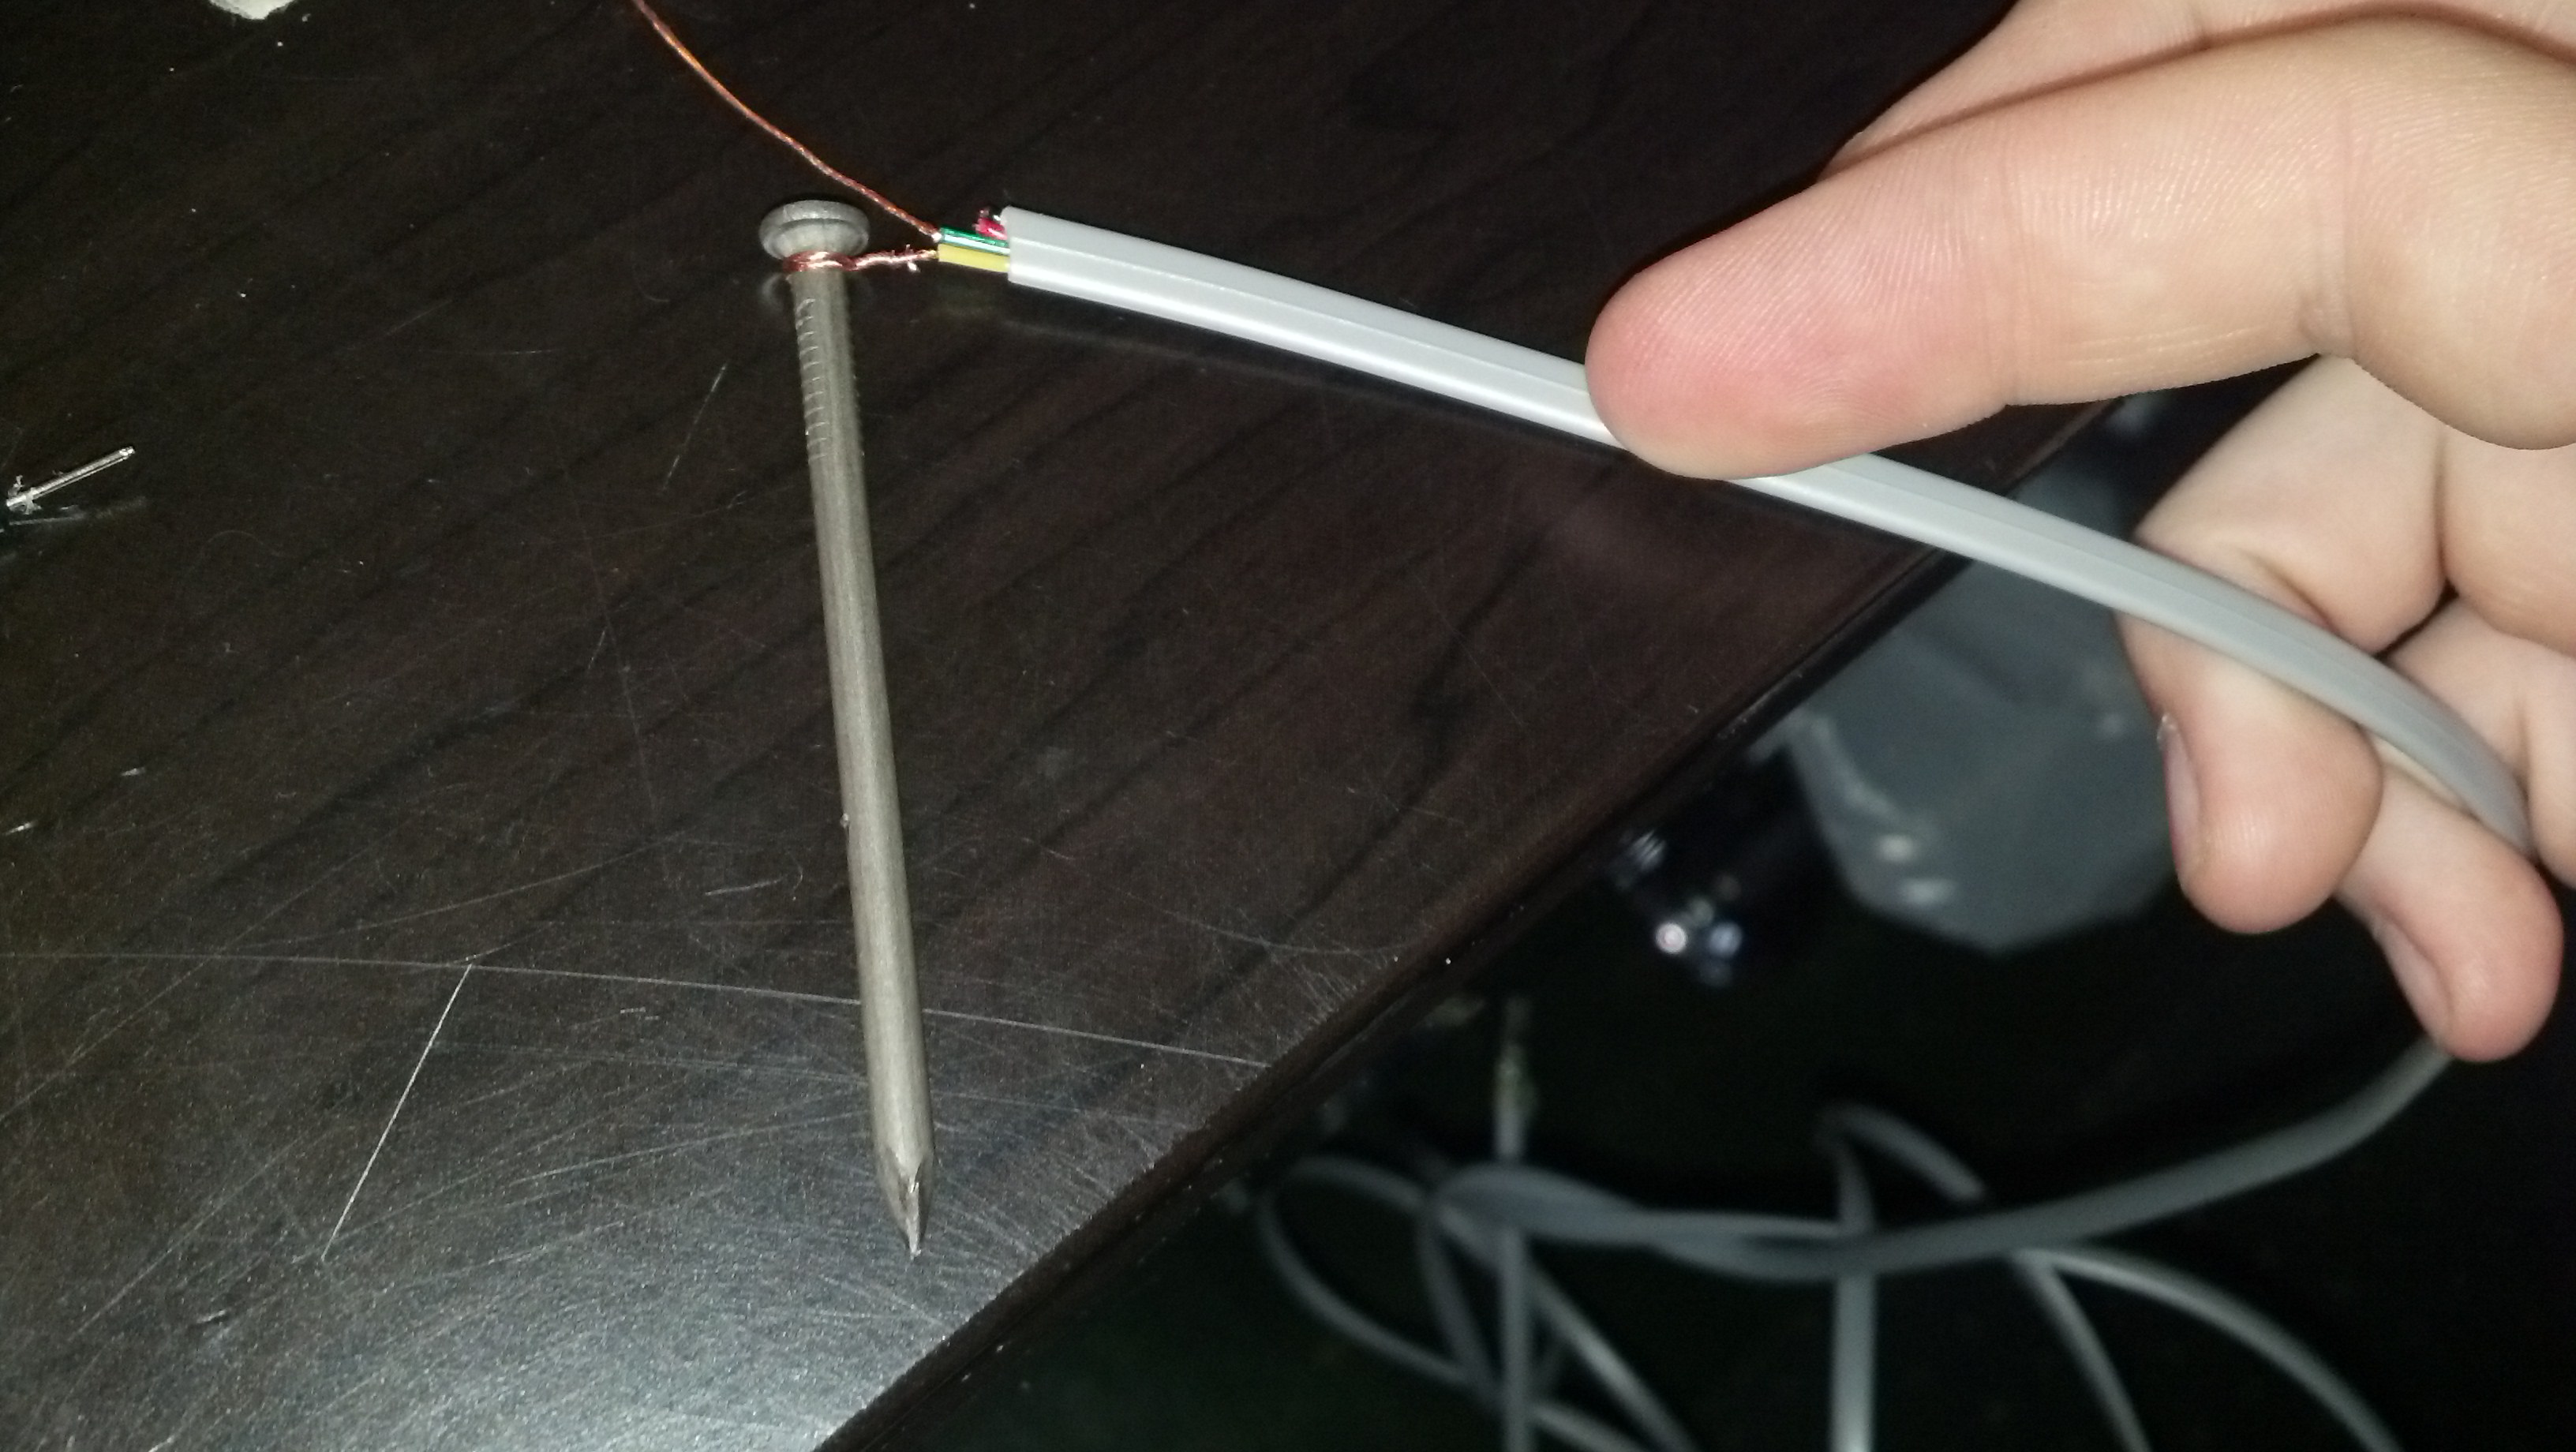
Here is the wire wrapped around the nail
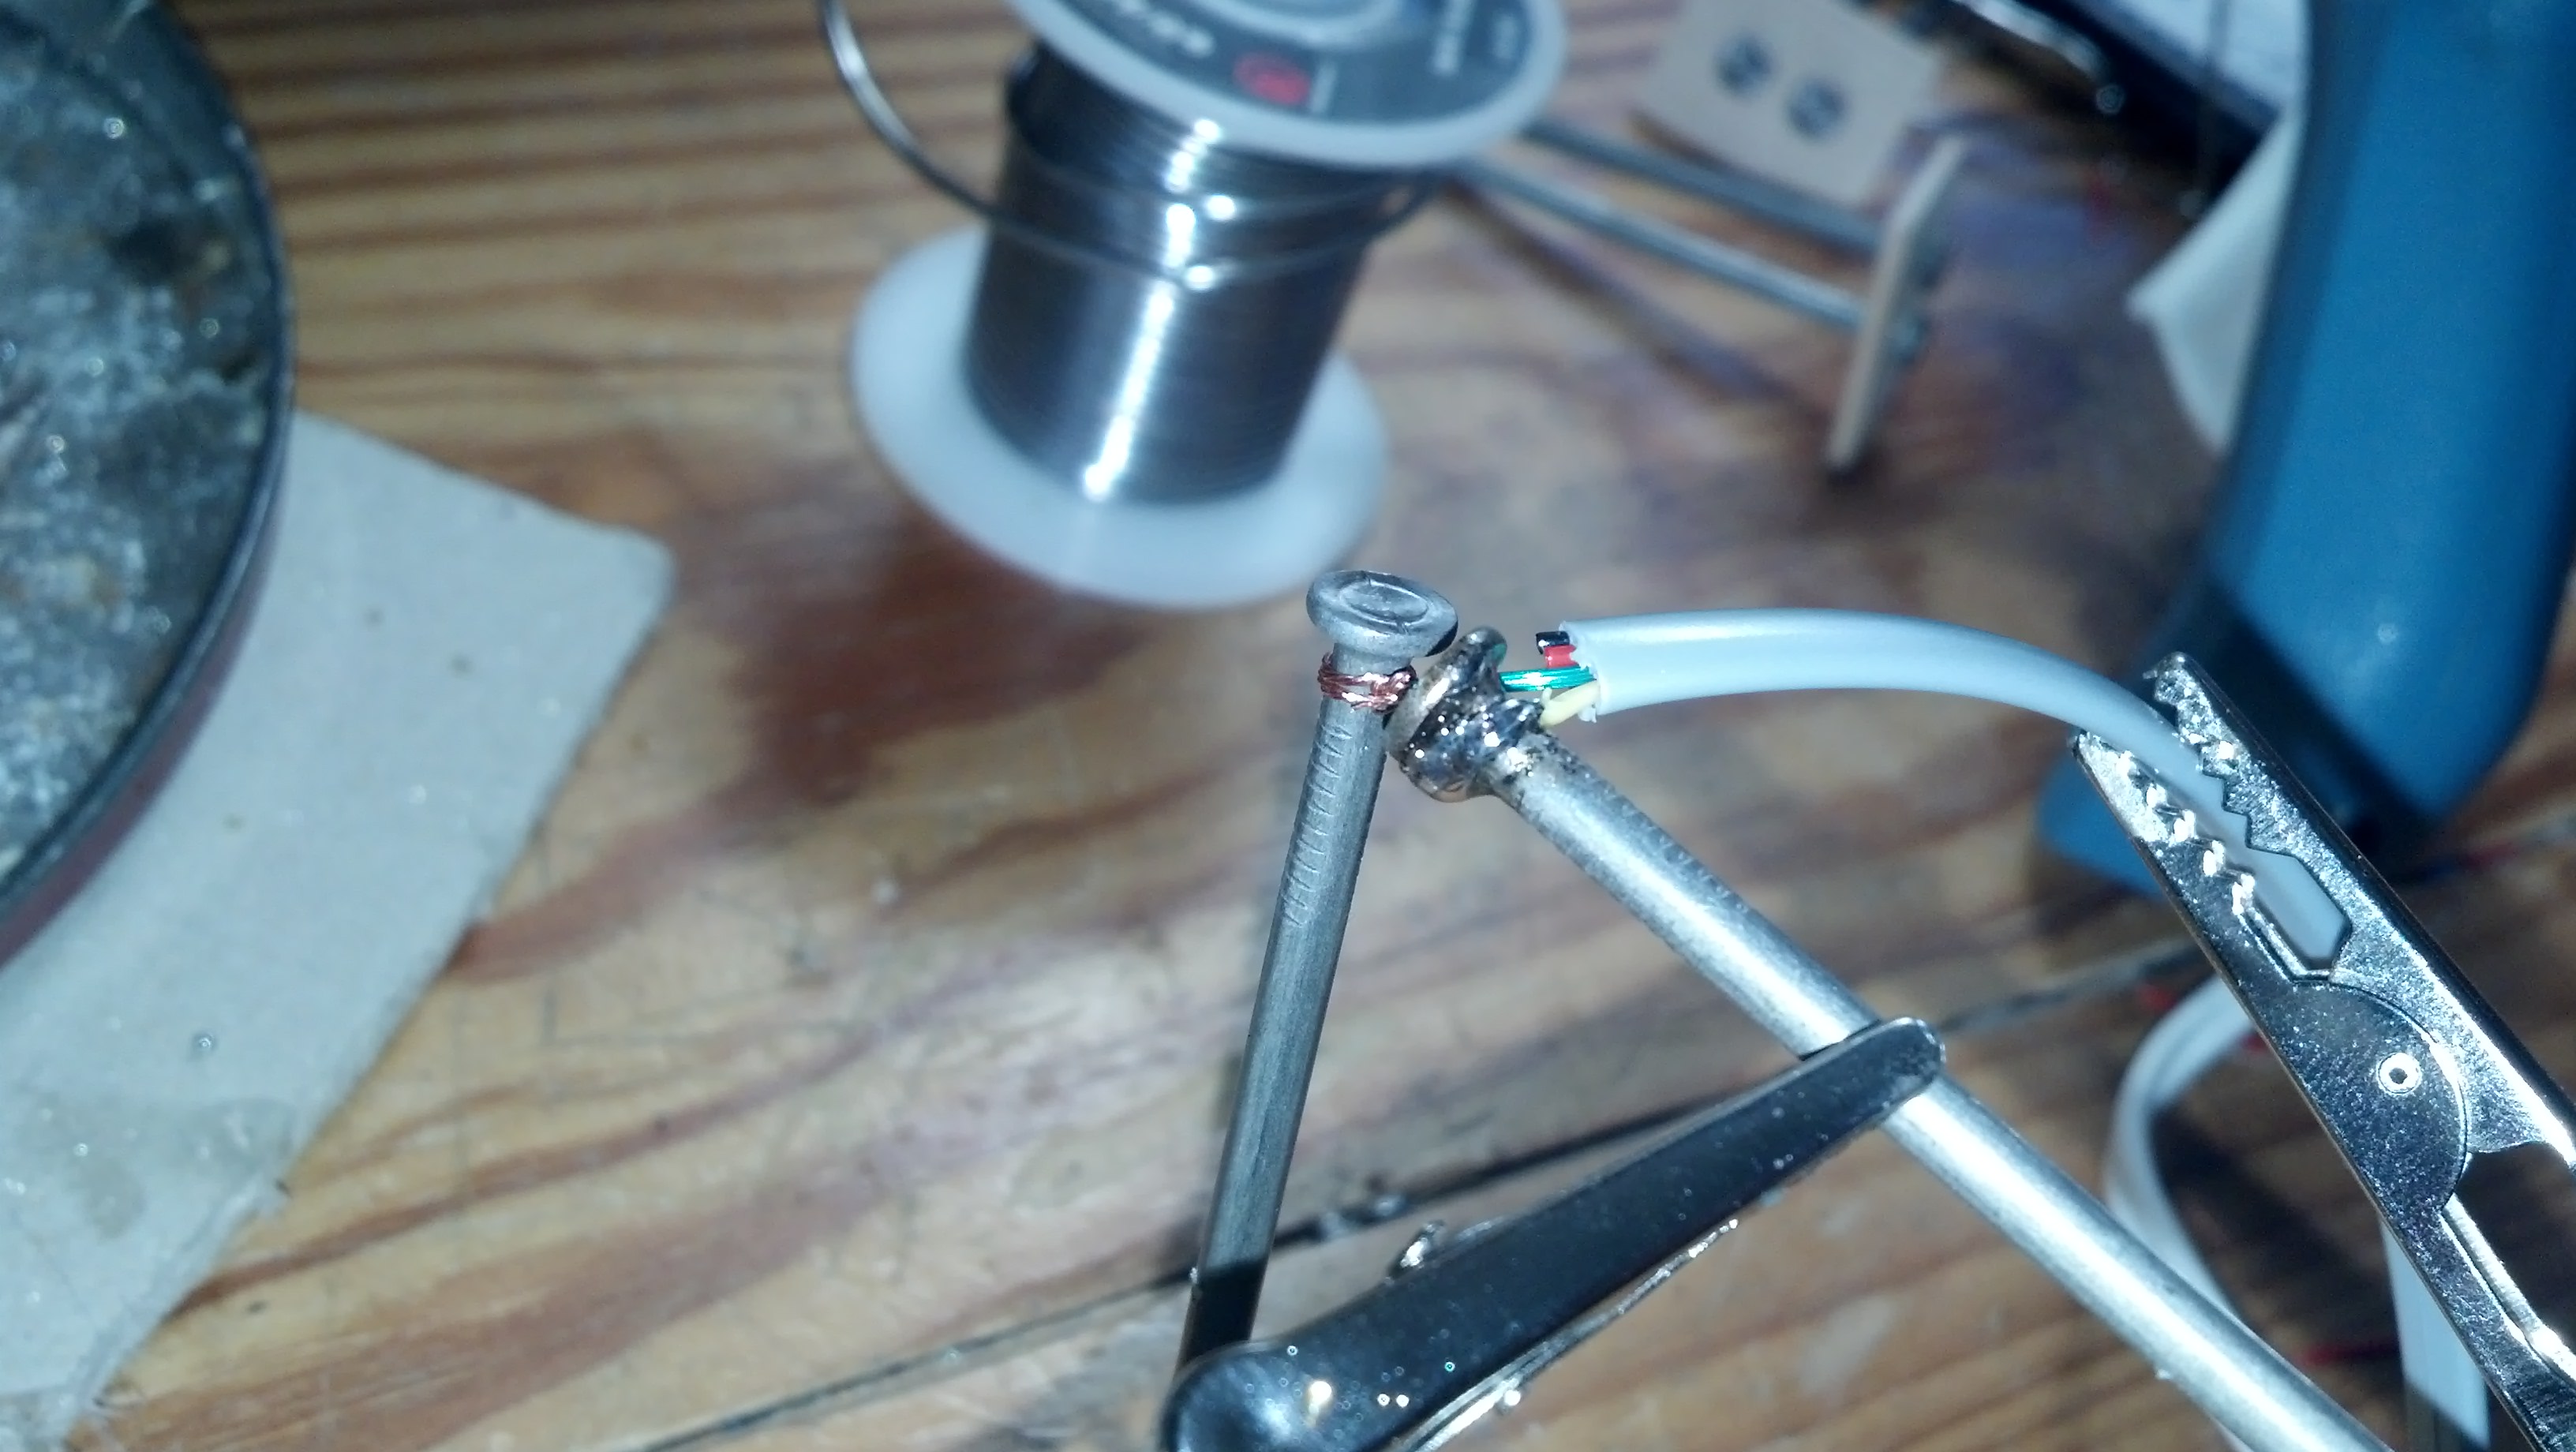
Once solder is applied, the connection is very strong and conductive
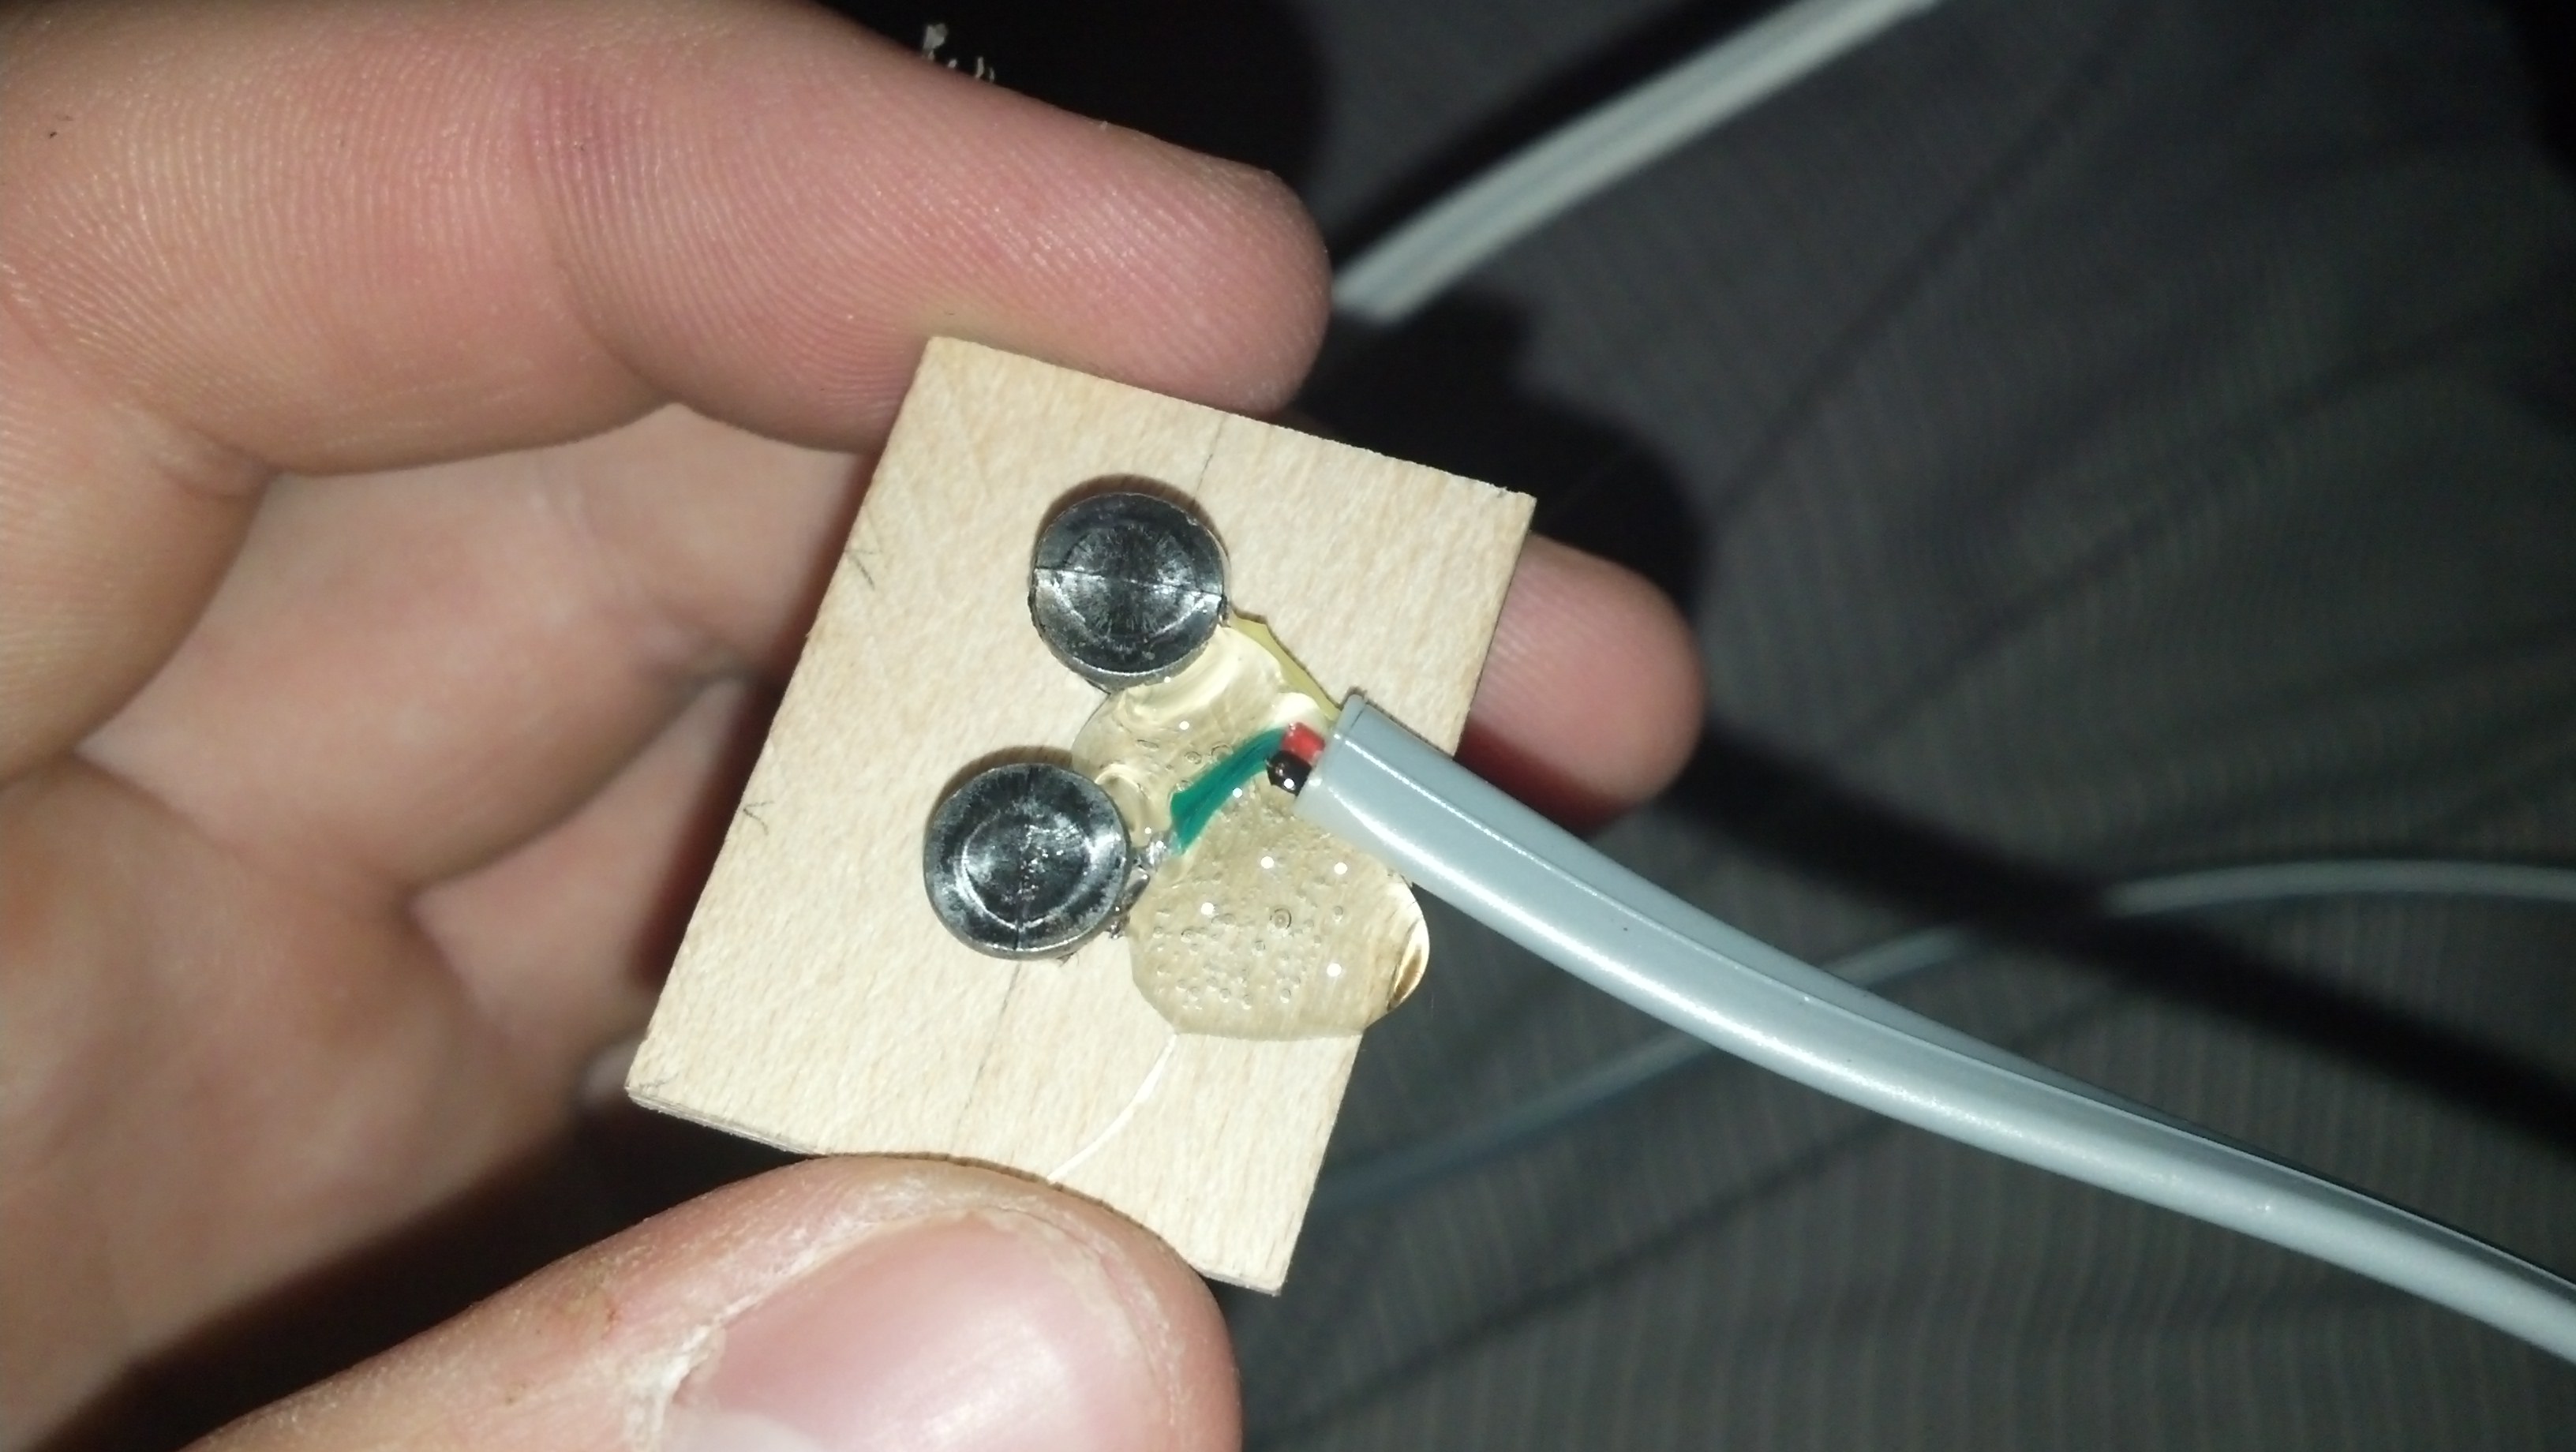
Here’s the gluing process
Here are all of the sensors assembled. I attached headers to the other ends as seen in the last post.
Since i’m using 4 sensors now, and to get around the oxidation problem, I added a NPN transistor to cut the ground current when the sensor isn’t being used so it only turns on when it’s getting polled. Here is the new python code:
|
1 2 3 4 5 6 7 8 9 10 11 12 13 14 15 16 17 18 19 20 21 22 23 24 25 26 27 28 29 30 31 32 33 34 35 36 37 38 39 40 41 42 43 44 45 46 47 48 49 50 51 52 53 54 55 56 57 58 59 60 61 62 63 64 65 66 67 68 69 70 71 72 73 74 75 76 77 78 79 80 81 |
#Timing setup from datetime import datetime from apscheduler.scheduler import Scheduler import time import datetime import sys now =datetime.datetime.now() import logging #if you start getting logging errors, uncomment these two lines logging.basicConfig() #GPIO setup import RPi.GPIO as GPIO GPIO.setmode(GPIO.BOARD) GPIO.cleanup() pin = 26 #pin for the adc GPIO.setup(pin, GPIO.OUT) NPNtrans = 3 #the pin for the npn transistor GPIO.setup(NPNtrans, GPIO.OUT) sampleLED = 5 #the indicator LED GPIO.setup(sampleLED, GPIO.OUT) #the adc's SPI setup import spidev spi = spidev.SpiDev() spi.open(0, 0) import MySQLdb con = MySQLdb.connect('localhost','piplanter_user','piplanter_pass','piplanter'); cursor = con.cursor() #fuction that can read the adc def readadc(adcnum): # read SPI data from MCP3008 chip, 8 possible adc's (0 thru 7) if adcnum > 7 or adcnum < 0: return -1 r = spi.xfer2([1, 8 + adcnum << 4, 0]) adcout = ((r[1] & 3) << 8) + r[2] return adcout def slowSample(): GPIO.output(NPNtrans, True) GPIO.output(sampleLED, True) sampleTime =time.ctime() mst1 = readadc(0) mst2 = readadc(1) mst3 = readadc(2) mst4 = readadc(3) pot1 = readadc(4) ldr1 = readadc(5) millivolts = readadc(6)*(3300.0/1024.0) temp_c = ((millivolts - 100.0)/10)-40.0 tmp1 = (temp_c * 9.0 / 5.0) + 32 print sampleTime,"|","MST1:",mst1,"MST2:",mst2,"MST3:",mst3,"MST4:",mst4,"Pot1:",pot1,"LDR1:",ldr1,"TMP1:",tmp1 #prints the debug info cursor.execute("INSERT INTO piplanter_table_13(Time,mst1_V,mst2_V,mst3_V,mst4_V,pot1_V,ldr1_V,tmp1_F) VALUES(%s,%s,%s,%s,%s,%s,%s,%s)",(sampleTime,mst1,mst2,mst3,mst4,pot1,ldr1,tmp1)) con.commit() #this is important for live updating time.sleep(.1) GPIO.output(sampleLED, False) GPIO.output(NPNtrans, False) slowSample() if __name__ == '__main__': #the following 3 lines start up the interval job and keep it going scheduler = Scheduler(standalone=True) scheduler.add_interval_job(slowSample, hours=1) scheduler.start() |
It’s pretty much the same thing.
The graph is also very similar, but I won’t post that code as it’s not different enough.
Here are pictures of setting up the whole system:
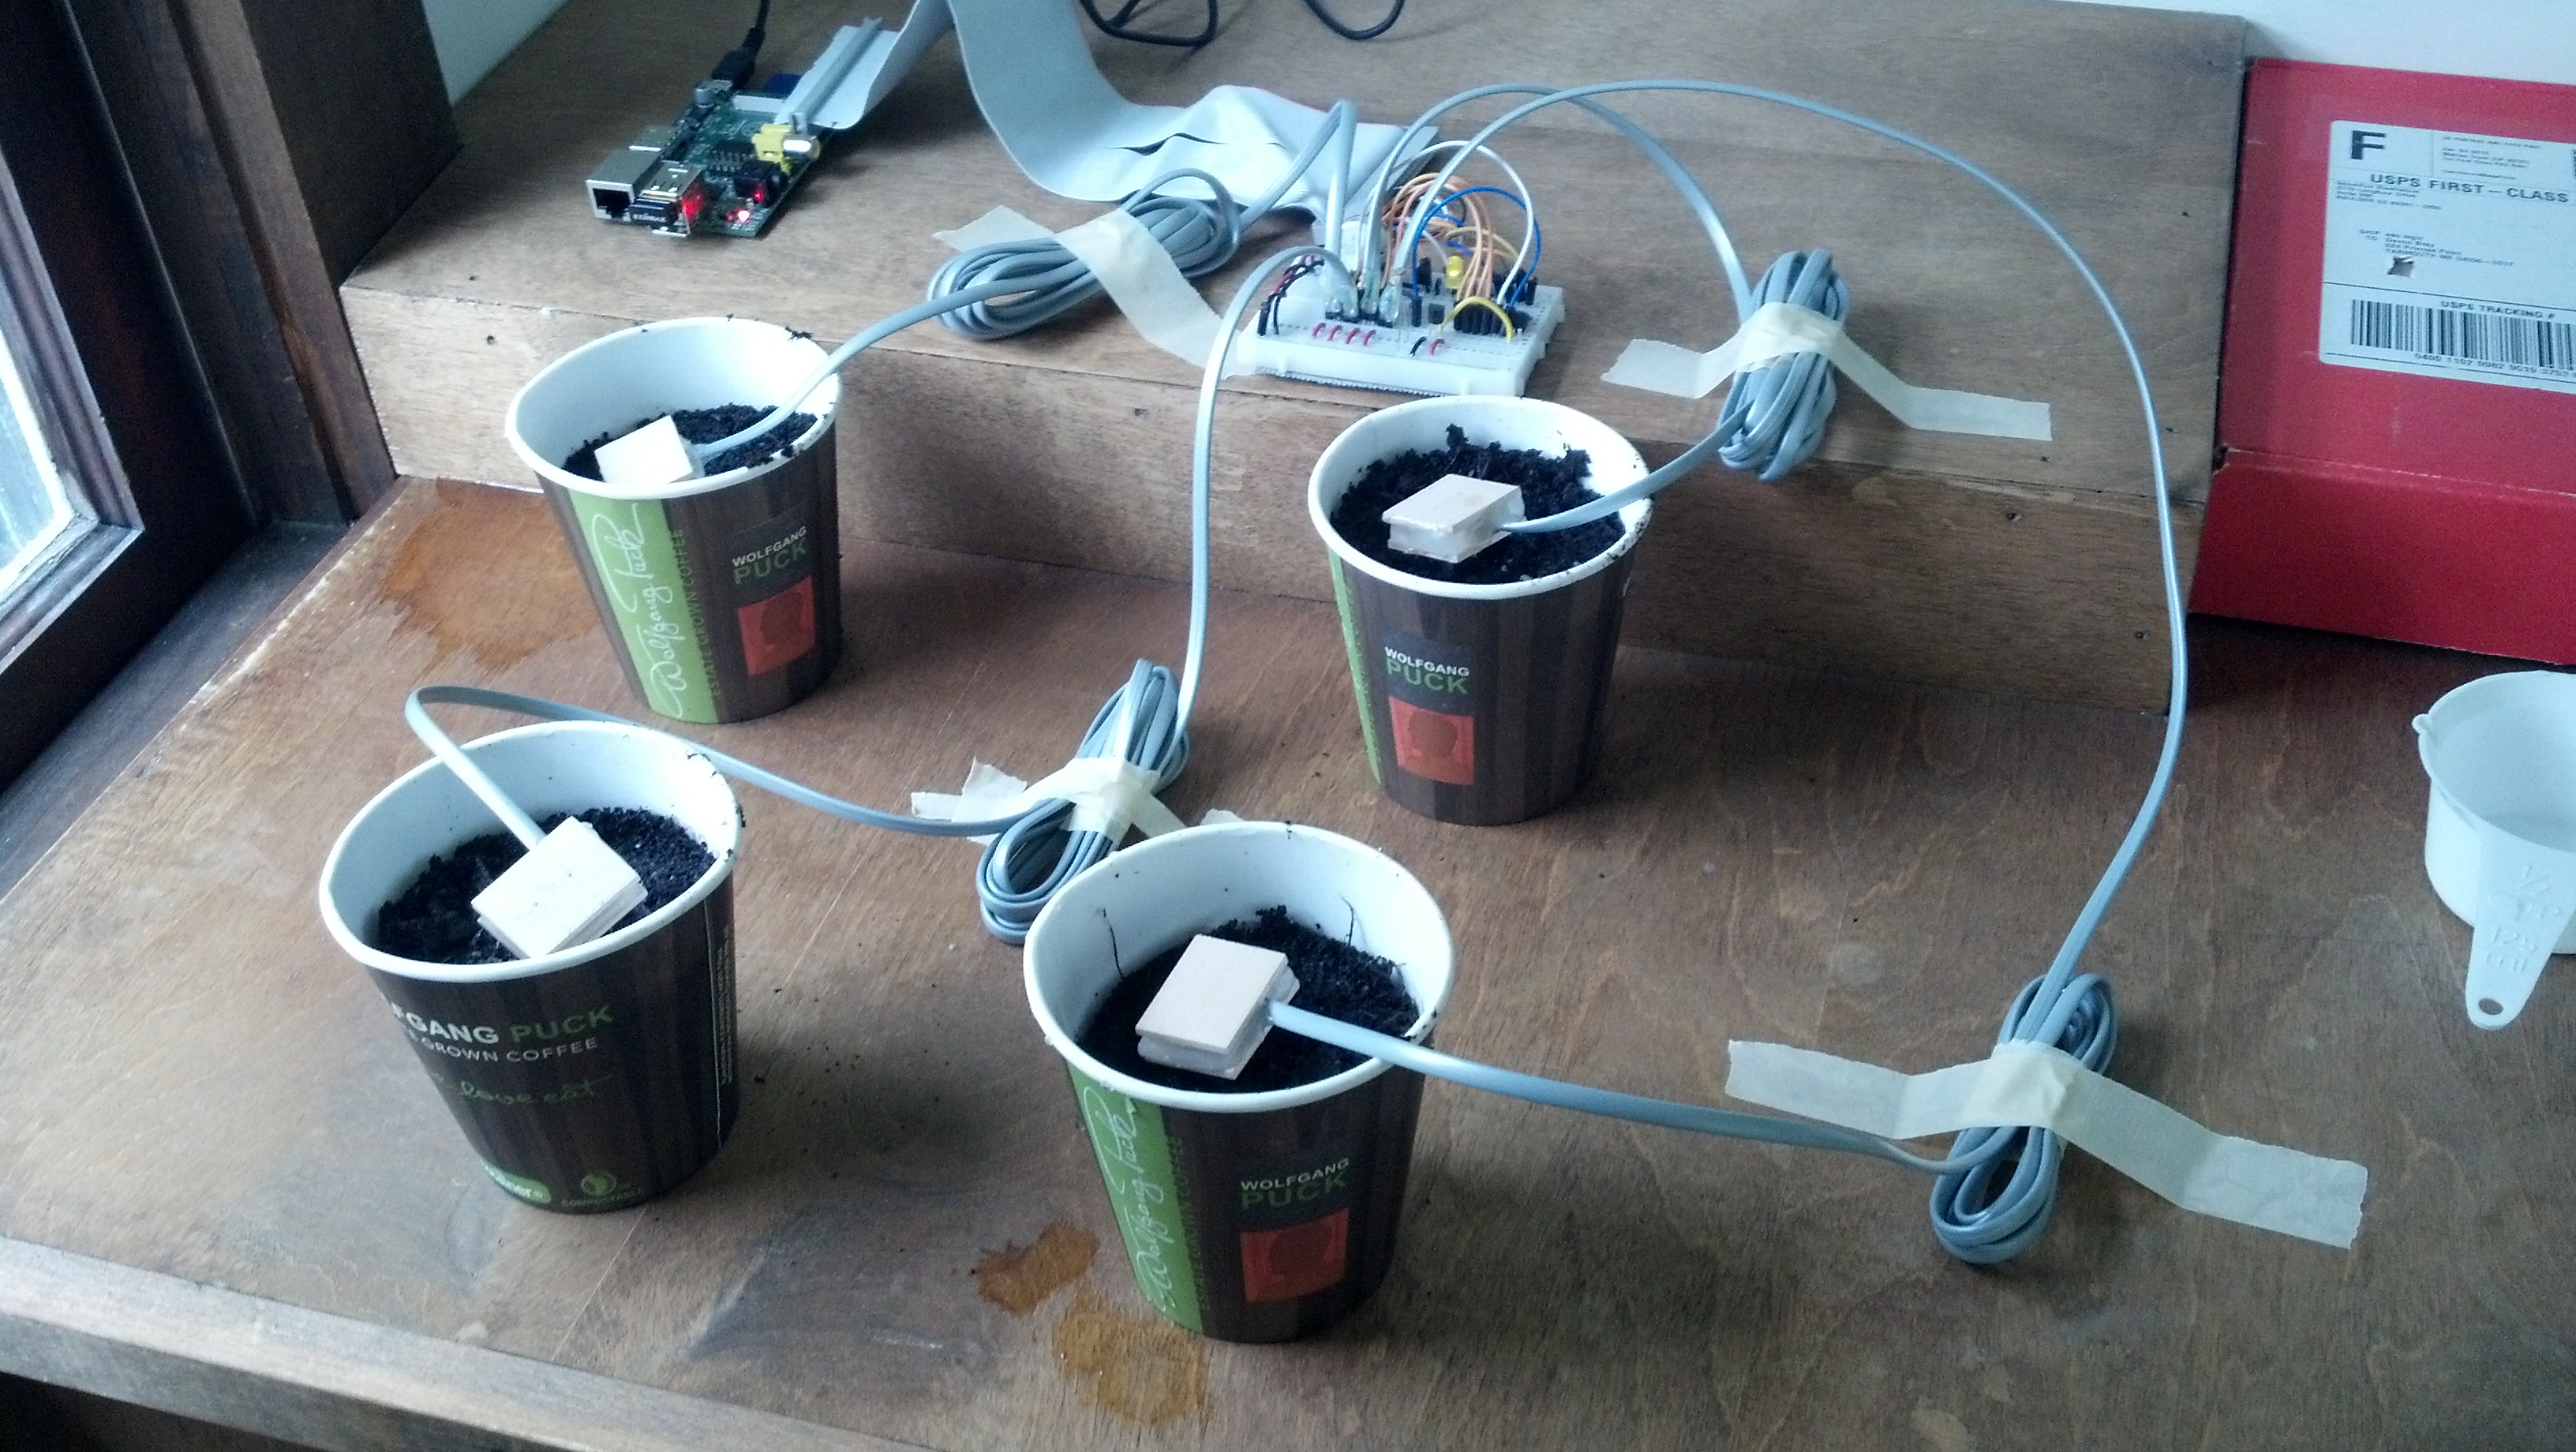
I used the same soil as seen in the previous post, and added 125mL of water to each sample.
Here’s a video of me explaining the whole process:
Once enough data is collected I’ll post a graph of it here.

This is a short post illustrating the process of planting the seeds.


Long time viewers will remember when this idea was conceived two Novembers ago, but essentially it’s a way to detect the relative moisture of a substance.
The principal is the same as in the above post, but this time, I made it bigger and attached it to a Raspberry Pi. The reason this is essential, is because I recently purchased a 12v DC pump capable of moving water. I will be able to sense the relative moisture in the plant, and then the plant will be able to water “itself”.
That will be done in python with the same basic technique I’ve been using all along, but in addition to gathering data about the plant every hour or so, it will be able to see if the plant needs water (by checking hopefully an array of moisture sensors) and then turning on the pump and watering it. I will also eventually integrate twitter and a webcam, but those cosmetic editions come once I know the system works.
To test it, I’ve added another set of data to the graph as seen in the last post and created a testing environment in my windowsill.
Basically I’ve put some dirt and 100mL of water into a container and inserted the sensor and am monitoring the moisture level over the next n hours, here are some pictures:





And here is a graph of some of the data:
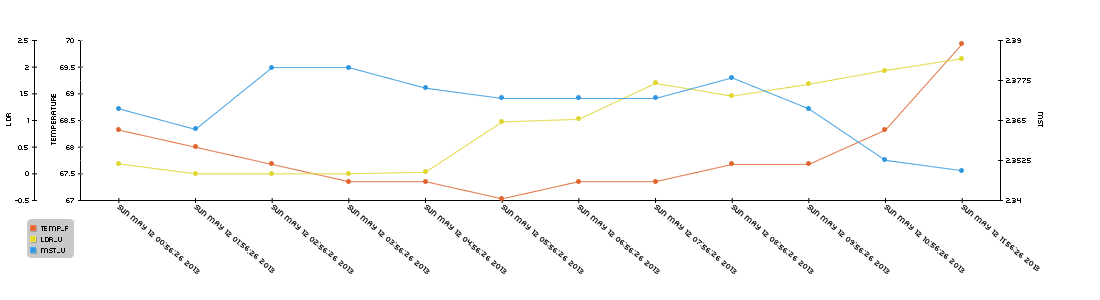
I will make another post later today illustrating the process of plating the seeds.

Time to get this data we’re harvesting graphed. In a couple past posts, I’ve used pChart to graph random data but now since data is getting dumped into a mysql chart, it would make sense to try and graph that data.
To install pChart on my system (same installs as listed in this post) to do that do the following:
First, get the php5-gd package by running:
|
1 |
sudo apt-get install php5-gd |
Then download, rename and move the pChart files to the proper directory:
|
1 2 3 4 |
sudo mkdir /srv/www/lib/ sudo wget http://www.pchart.net/release/pChart2.1.3.tar.gz sudo tar -xzvf pChart2.1.3.tar.gz sudo mv pChart2.1.3 pChart |
Now pChart is ready to be used.
I used a lot of the info found here:
http://wiki.pchart.net/doc.mysql.integration.html
http://wiki.pchart.net/doc.doc.draw.scale.html
The code is pretty well commented so I’m not really going to get into describing it, but essentially, the following php will retrieve data from a mysql table (which is being populated by a python script seen in this post) and after leaving it on in my room for like 3 days, render this graph:
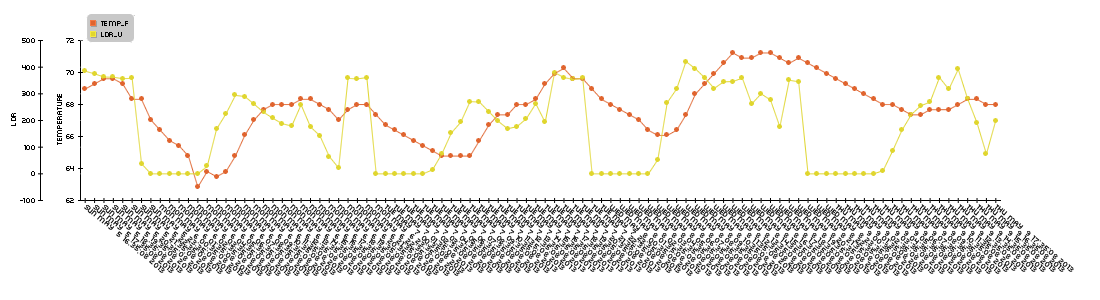
Here’s that php script:
|
1 2 3 4 5 6 7 8 9 10 11 12 13 14 15 16 17 18 19 20 21 22 23 24 25 26 27 28 29 30 31 32 33 34 35 36 37 38 39 40 41 42 43 44 45 46 47 48 49 50 51 52 53 54 55 56 57 58 59 60 61 62 63 |
<?php /* Include all the classes */ include("/srv/www/lib/pChart/class/pData.class.php"); include("/srv/www/lib/pChart/class/pDraw.class.php"); include("/srv/www/lib/pChart/class/pImage.class.php"); /* Create your dataset object */ $myData = new pData(); $db = mysql_connect("localhost", "piplanter_user", "piplanter_pass"); //location of server, db username, db pass mysql_select_db("piplanter", $db); $Requete = "SELECT * FROM `piplanter_table_05`"; //table name $Result = mysql_query($Requete, $db); /*This fetches the data from the mysql database, and adds it to pchart as points*/ while($row = mysql_fetch_array($Result)) { //$Sample_Number = $row["Sample_Number"]; //Not using this data //$myData->addPoints($Sample_Number,"Sample_Number"); $Time = $row["Time"]; $myData->addPoints($Time,"Time"); $Temp_F = $row["Temp_F"]; $myData->addPoints($Temp_F,"Temp_F"); $LDR_V = $row["LDR_V"]; $myData->addPoints($LDR_V,"LDR_V"); } $myData-> setSerieOnAxis("Temp_F", 0); //assigns the data to the frist axis $myData-> setAxisName(0, "Temperature"); //adds the label to the first axis $myData-> setSerieOnAxis("LDR_V", 1); $myData-> setAxisName(1, "LDR"); $myData-> setAxisPosition(1,AXIS_POSITION_LEFT); //moves the second axis to the far left $myData->setAbscissa("Time"); //sets the time data set as the x axis label $myPicture = new pImage(1100,300,$myData); /* Create a pChart object and associate your dataset */ $myPicture->setFontProperties(array("FontName"=>"/srv/www/lib/pChart/fonts/pf_arma_five.ttf","FontSize"=>6)); /* Choose a nice font */ $myPicture->setGraphArea(80,40,1000,200); /* Define the boundaries of the graph area */ $Settings = array("R"=>250, "G"=>250, "B"=>250, "Dash"=>1, "DashR"=>0, "DashG"=>0, "DashB"=>0); $myPicture->drawScale(array("LabelRotation"=>320)); /* Draw the scale, keep everything automatic */ /*The combination makes a cool looking graph*/ $myPicture->drawPlotChart(); $myPicture->drawLineChart(); $myPicture->drawLegend(90,20); //adds the legend $myPicture->autoOutput(); /* Build the PNG file and send it to the web browser */ ?> |
I’m in a hotel trying to occupy myself with something interesting so I’ve decided to work on this. I had to re-image the SD card I’ve been developing this project on, but I saved to code so there’s no problem there. Now I need to re-install all the basic packages.
First I need to get the components of a LAMP server with the following commands:
|
1 2 3 4 5 |
sudo apt-get install apache2 sudo apt-get install mysql-server sudo apt-get install php5 sudo apt-get install php5-server sudo apt-get install php5-mysql |
Once you get the mysql server setup, you’ll need to create a database and tables in mysql.
To create the database you’ll be using run the following command:
|
1 |
CREATE DATABASE piplanter; |
And then grant the proper privileges to use later with the command:
|
1 2 |
mysql> mysql> GRANT ALL PRIVILEGES ON piplanter.* TO 'user'@'localhost' IDENTIFIED BY 'pass'; FLUSH PRIVILEGES; |
Then we can enter the database and create a table:
|
1 2 |
USE piplanter; CREATE TABLE piplanter_table_01(Sample_Number INT NOT NULL AUTO_INCREMENT PRIMARY KEY, Time VARCHAR(100), Temp_F VARCHAR(100), LDR_V VARCHAR(100) ); |
Now we need to set up the specific libraries for python the first of which being spidev, the spi tool for the raspberry pi which we can grab from git using the following commands:
|
1 2 3 4 5 |
sudo apt-get install git git clone git://github.com/doceme/py-spidev cd py-spidev/ sudo apt-get install python-dev sudo python setup.py install |
You also need to (copied from http://scruss.com/blog/2013/01/19/the-quite-rubbish-clock/):
As root, edit the kernel module blacklist file:
|
1 |
sudo vi /etc/modprobe.d/raspi-blacklist.conf |
Comment out the spi-bcm2708 line so it looks like this:
|
1 |
#blacklist spi-bcm2708 |
Save the file so that the module will load on future reboots. To enable the module now, enter:
|
1 |
sudo modprobe spi-bcm2708 |
We will also need WiringPi:
|
1 2 3 |
sudo apt-get install python-imaging python-imaging-tk python-pip python-dev git sudo pip install spidev sudo pip install wiringpi |
Then you need to get APscheduler, the timing program used to execute the incremental timing with the following commands:
|
1 2 3 |
wget https://pypi.python.org/packages/source/A/APScheduler/APScheduler-2.1.0.tar.gz sudo tar -xzvf APScheduler-2.1.0.tar.gz python setup.py install |
You will need mysqldb to interface python and mysql:
|
1 |
sudo apt-get install python-mysqldb |
Once you reboot, the following program should work:
|
1 2 3 4 5 6 7 8 9 10 11 12 13 14 15 16 17 18 19 20 21 22 23 24 25 26 27 28 29 30 31 32 33 34 35 36 37 38 39 40 41 42 43 44 45 46 47 48 49 50 51 52 53 54 55 56 57 58 59 60 61 62 63 64 65 66 67 68 69 70 71 72 73 74 75 76 77 78 79 80 81 82 |
#Timing setup from datetime import datetime from apscheduler.scheduler import Scheduler import time import datetime import sys now =datetime.datetime.now() import logging #if you start getting logging errors, uncomment these two lines logging.basicConfig() #GPIO setup import RPi.GPIO as GPIO GPIO.setmode(GPIO.BOARD) GPIO.cleanup() pin = 26 #pin for the adc GPIO.setup(pin, GPIO.OUT) led1 = 11 #pin for the short indicator led GPIO.setup(led1, GPIO.OUT) led2 = 13 #pin for other long indicator led GPIO.setup(led2, GPIO.OUT) #the adc's SPI setup import spidev spi = spidev.SpiDev() spi.open(0, 0) import MySQLdb con = MySQLdb.connect('localhost','piplanter_user','piplanter_pass','piplanter'); cursor = con.cursor() #fuction that can read the adc def readadc(adcnum): # read SPI data from MCP3008 chip, 8 possible adc's (0 thru 7) if adcnum > 7 or adcnum < 0: return -1 r = spi.xfer2([1, 8 + adcnum << 4, 0]) adcout = ((r[1] & 3) << 8) + r[2] return adcout def rapidSample(): sampleTime = time.ctime() sampleTemp1 = (((readadc(0)*3.3)/1024)/(10.0/1000)) #this translates the analog voltage to temperature in def F sampleLght1 = readadc(1) samplePot1 = readadc(2) GPIO.output(led1, True) #turns the led on time.sleep(.1) #sleeps a little bit so you can see the LED on print "Job 1", sampleTime,"LDR:",sampleLght1 ,"Pot:",samplePot1,"Temp:",sampleTemp1 #prints the debug info cursor.execute("INSERT INTO piplanter_table_02(Time,Temp_F,LDR_V) VALUES(%s,'%s','%s')",(sampleTime,sampleTemp1,sampleLght1)) con.commit() #this is important for live updating time.sleep(.1) GPIO.output(led1, False) #turns the led off def slowSample(): sampleTime = time.ctime() sampleTemp1 = (((readadc(0)*3.3)/1024)/(10.0/1000)) #this translates the analog voltage to temperature in def F sampleLght1 = readadc(1) samplePot1 = readadc(2) GPIO.output(led2, True) #turns the led on time.sleep(5) print "Job 2", sampleTime,"LDR:",sampleLght1 ,"Pot:",samplePot1,"Temp:",sampleTemp1 #prints the debug info cursor.execute("INSERT INTO piplanter_table_03(Time,Temp_F,LDR_V) VALUES(%s,'%s','%s')",(sampleTime,sampleTemp1,sampleLght1)) con.commit() #this is important for live updating time.sleep(5) GPIO.output(led2, False) #turns the led on if __name__ == '__main__': #the following 3 lines start up the interval job and keep it going scheduler = Scheduler(standalone=True) scheduler.add_interval_job(rapidSample, minutes=1) scheduler.add_interval_job(slowSample, hours=1) scheduler.start() |
And there you go! The program should log data every minute and then every hour to two different tables. To view those data sets as php tables you can use this php script:
|
1 2 3 4 5 6 7 8 9 10 11 12 13 14 15 16 17 18 19 20 21 22 23 24 25 26 |
<?php mysql_connect("localhost", "piplanter_user","piplanter_pass") or die ("Could not connect: " . mysql_error()); mysql_select_db("piplanter"); $result = mysql_query("SELECT * FROM piplanter_table_02"); echo "<table border='1'> <tr> <th>Sample_Number</th> <th>Time</th> <th>Temp F</th> <th>LDR Value V</th> </tr>"; while($row = mysql_fetch_array($result)){ echo"<tr>"; echo"<td>" . $row['Sample_Number'] . "</td>"; echo"<td>" . $row['Time'] . "</td>"; echo"<td>" . $row['Temp_F'] . "</td>"; echo"<td>" . $row['LDR_V'] . "</td>"; echo"</tr>"; } echo "</table>"; mysql_close($con); ?> |
Sometime later I’ll get to graphing the data.
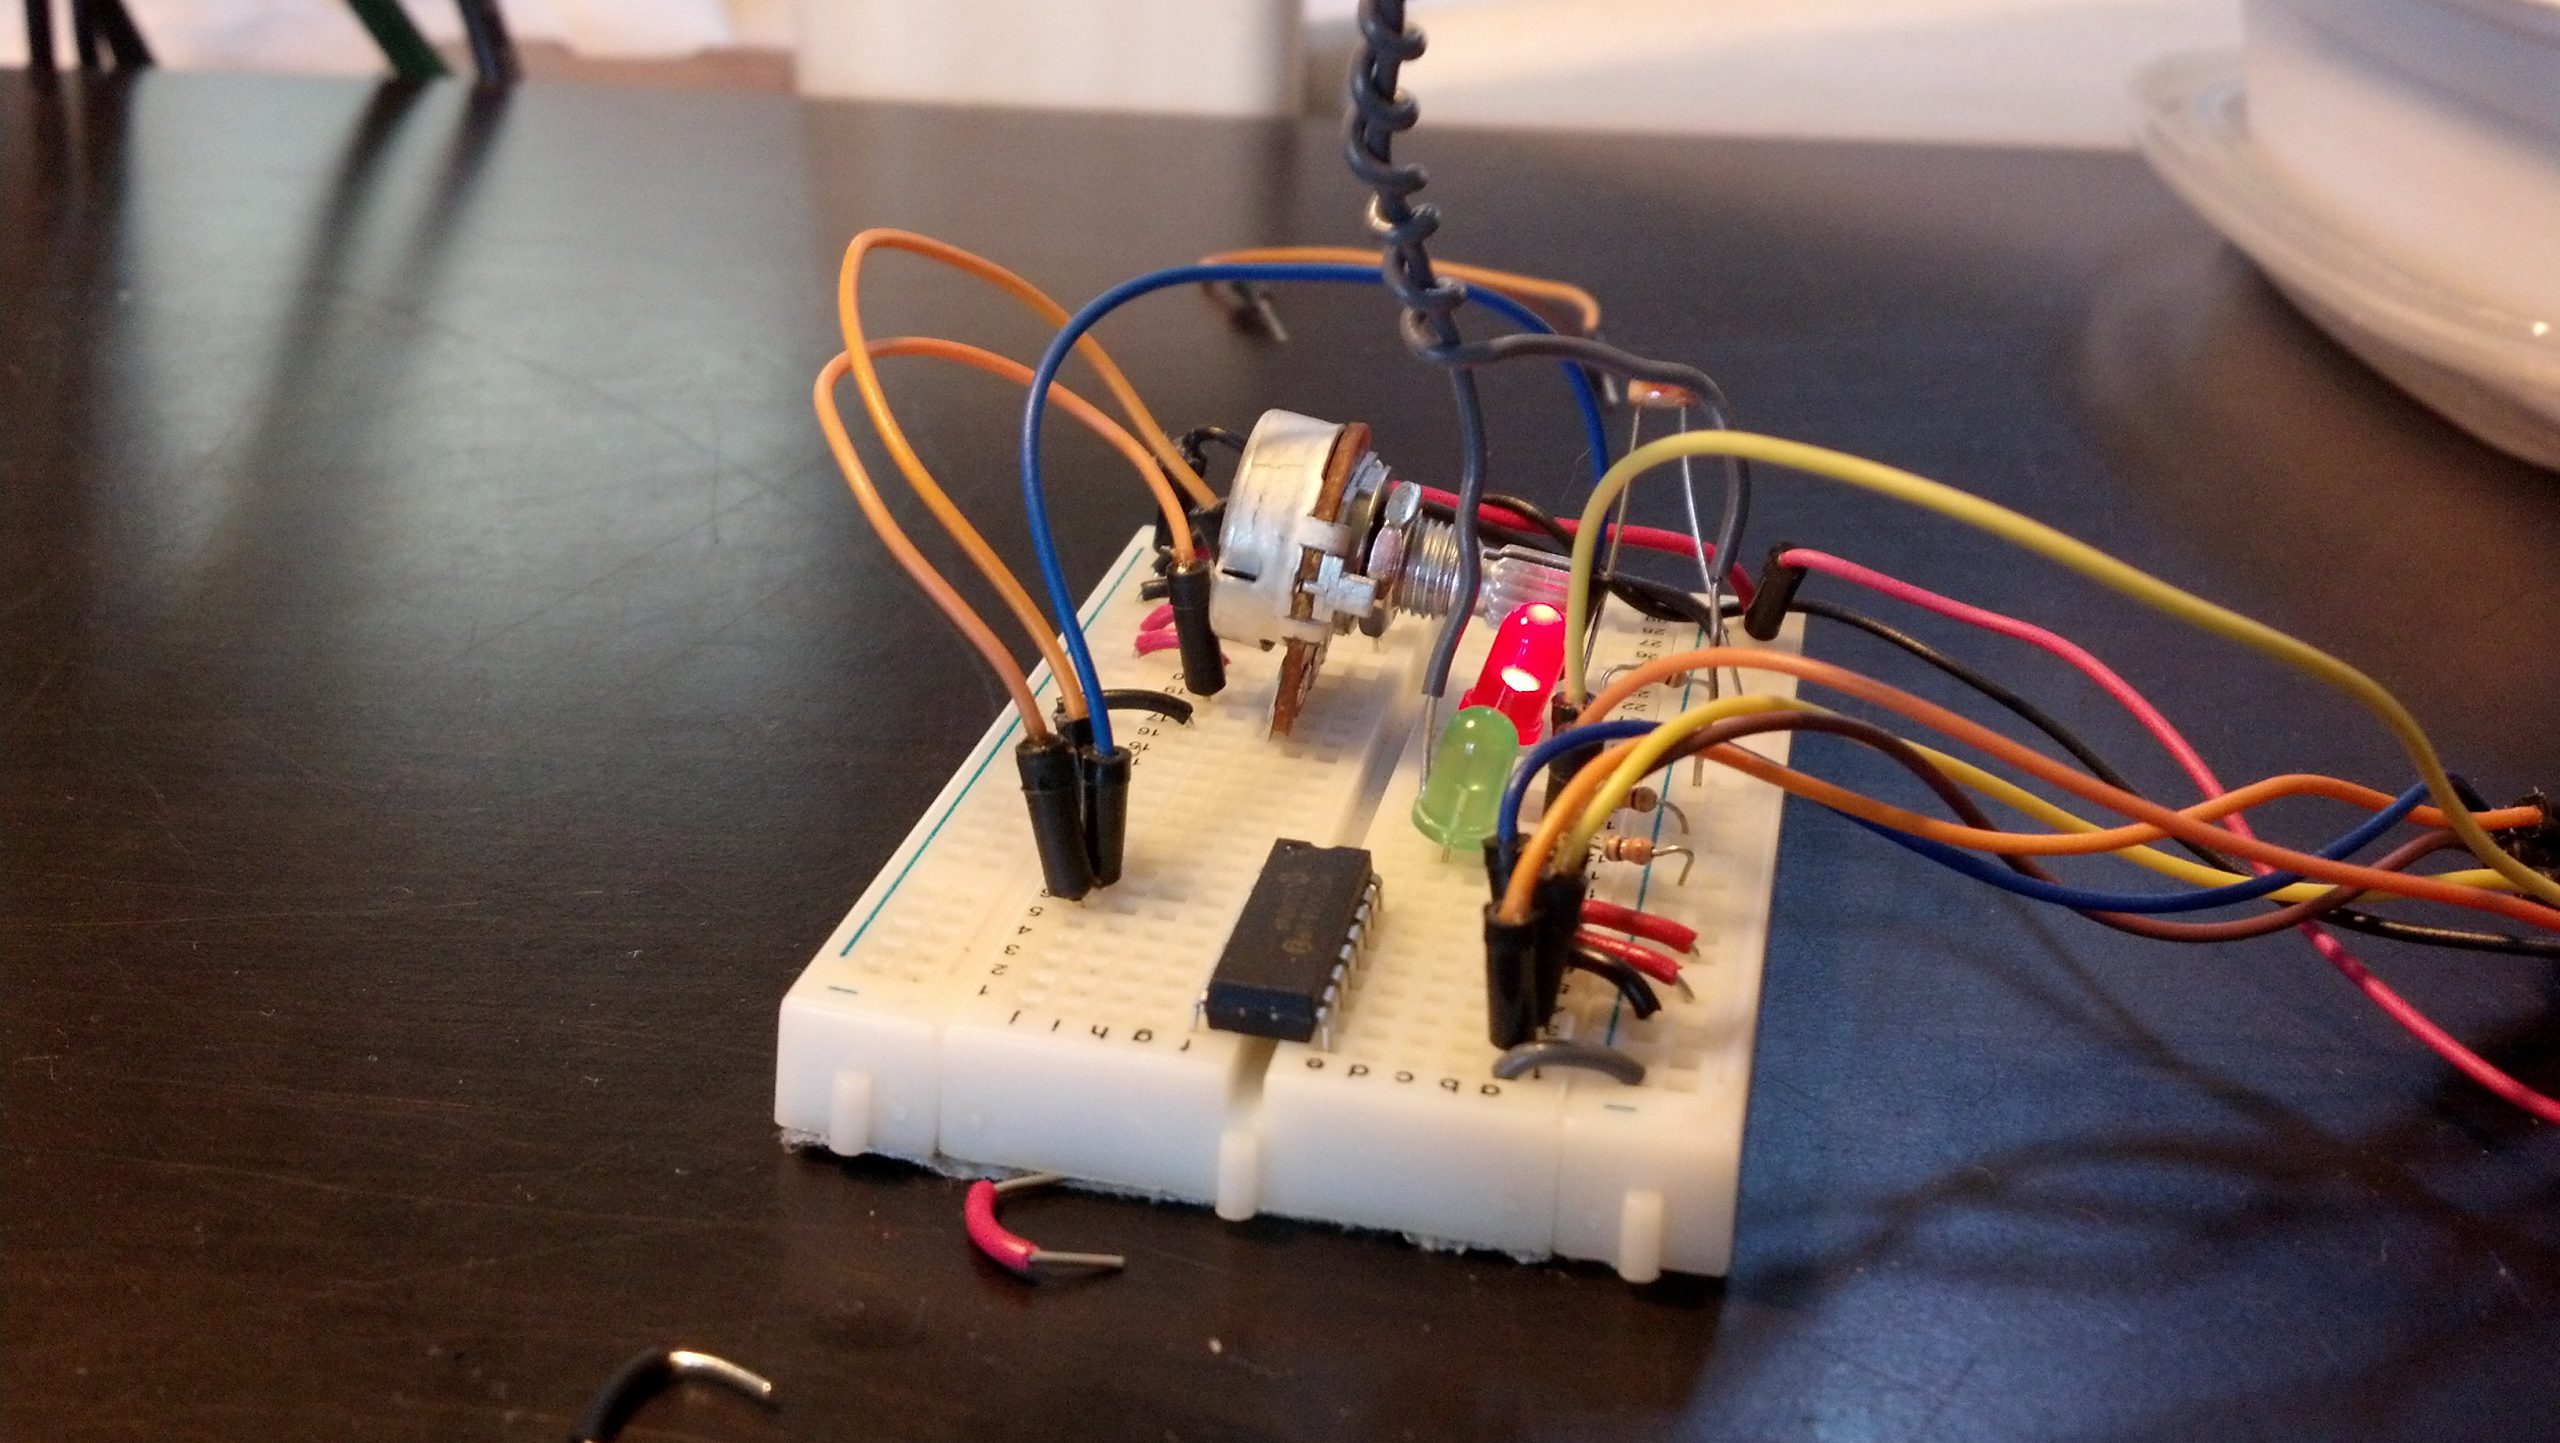
I’m taking a “break” from my drone while I save some money to buy more tricopter parts, and since the weather’s getting nicer and nicer I’ve decided to start working on my PiPlanter again.
As a refresher, the PiPlanter is a Raspberry Pi powered garden. The goal is for it to just be able to be plugged in and add water to a water source and have the Pi monitor temp and moisture levels to be able to add more water as needed.
I’ve shown that is relatively easy to go from analog sensors to good looking tables and graphs using the raspberry pi, the problem that I ran into however was timing.
It became harder and harder to use the time.sleep function in python to handle long periods of time. When you are dealing with things like plants, you don’t need to water it very often, but for data’s sake, you should be polling the sensors a lot.
I’ve landed on the use of APScheduler in python, and here’s my source code:
[py]
#Timing setup
from datetime import datetime
from apscheduler.scheduler import Scheduler
import time
import logging #if you start getting logging errors, uncomment these two lines
logging.basicConfig()
#GPIO setup
import RPi.GPIO as GPIO
GPIO.setmode(GPIO.BOARD)
GPIO.cleanup()
pin = 26 #pin for the adc
GPIO.setup(pin, GPIO.OUT)
led1 = 11 #pin for the short indicator led
GPIO.setup(led1, GPIO.OUT)
led2 = 13 #pin for other long indicator led
GPIO.setup(led2, GPIO.OUT)
#the adc’s SPI setup
import spidev
spi = spidev.SpiDev()
spi.open(0, 0)
going = True
#fuction that can read the adc
def readadc(adcnum):
# read SPI data from MCP3008 chip, 8 possible adc’s (0 thru 7)
if adcnum > 7 or adcnum < 0:
return -1
r = spi.xfer2([1, 8 + adcnum << 4, 0])
adcout = ((r[1] & 3) << 8) + r[2]
return adcout
def rapidSample():
sampleTemp1 = (((readadc(0)*3.3)/1024)/(10.0/1000)) #this translates the analog voltage to temperature in def F
sampleLght1 = readadc(1)
samplePot1 = readadc(2)
GPIO.output(led1, True) #turns the led on
time.sleep(.1) #sleeps a little bit so you can see the LED on
print “Job 1″, datetime.now(),”LDR:”,sampleLght1 ,”Pot:”,samplePot1,”Temp:”,sampleTemp1 #prints the debug info
time.sleep(.1)
GPIO.output(led1, False) #turns the led off
def slowSample():
print “Job 2” , datetime.now()
GPIO.output(led2, True) #turns the led on
time.sleep(5)
GPIO.output(led2, False) #turns the led on
if __name__ == ‘__main__’:
#the following 3 lines start up the interval job and keep it going
scheduler = Scheduler(standalone=True)
scheduler.add_interval_job(rapidSample, seconds=1)
scheduler.add_interval_job(slowSample, minutes=1)
scheduler.start()
[/py]
This produces a loop that flashed a green led on and of for .1 seconds at a time per second, and then every minute, turns on a speaker and a red led for 5 seconds then turns it off. There are some images of what goes on below.
Here is a picture of the the print dialog in python:
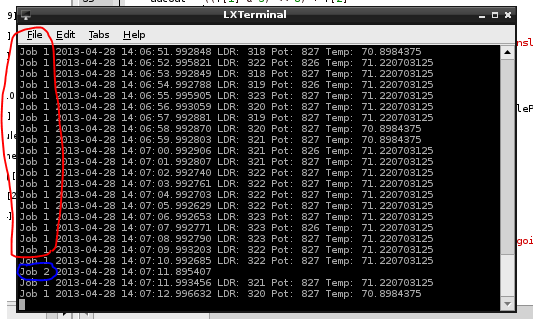
You can see that the first job (green led) posts the values from the analog sensors every second
The second job (red led) just posts the time. But the function is expandable to do anything at any time.
Here are pictures of the board and the circuit in action:
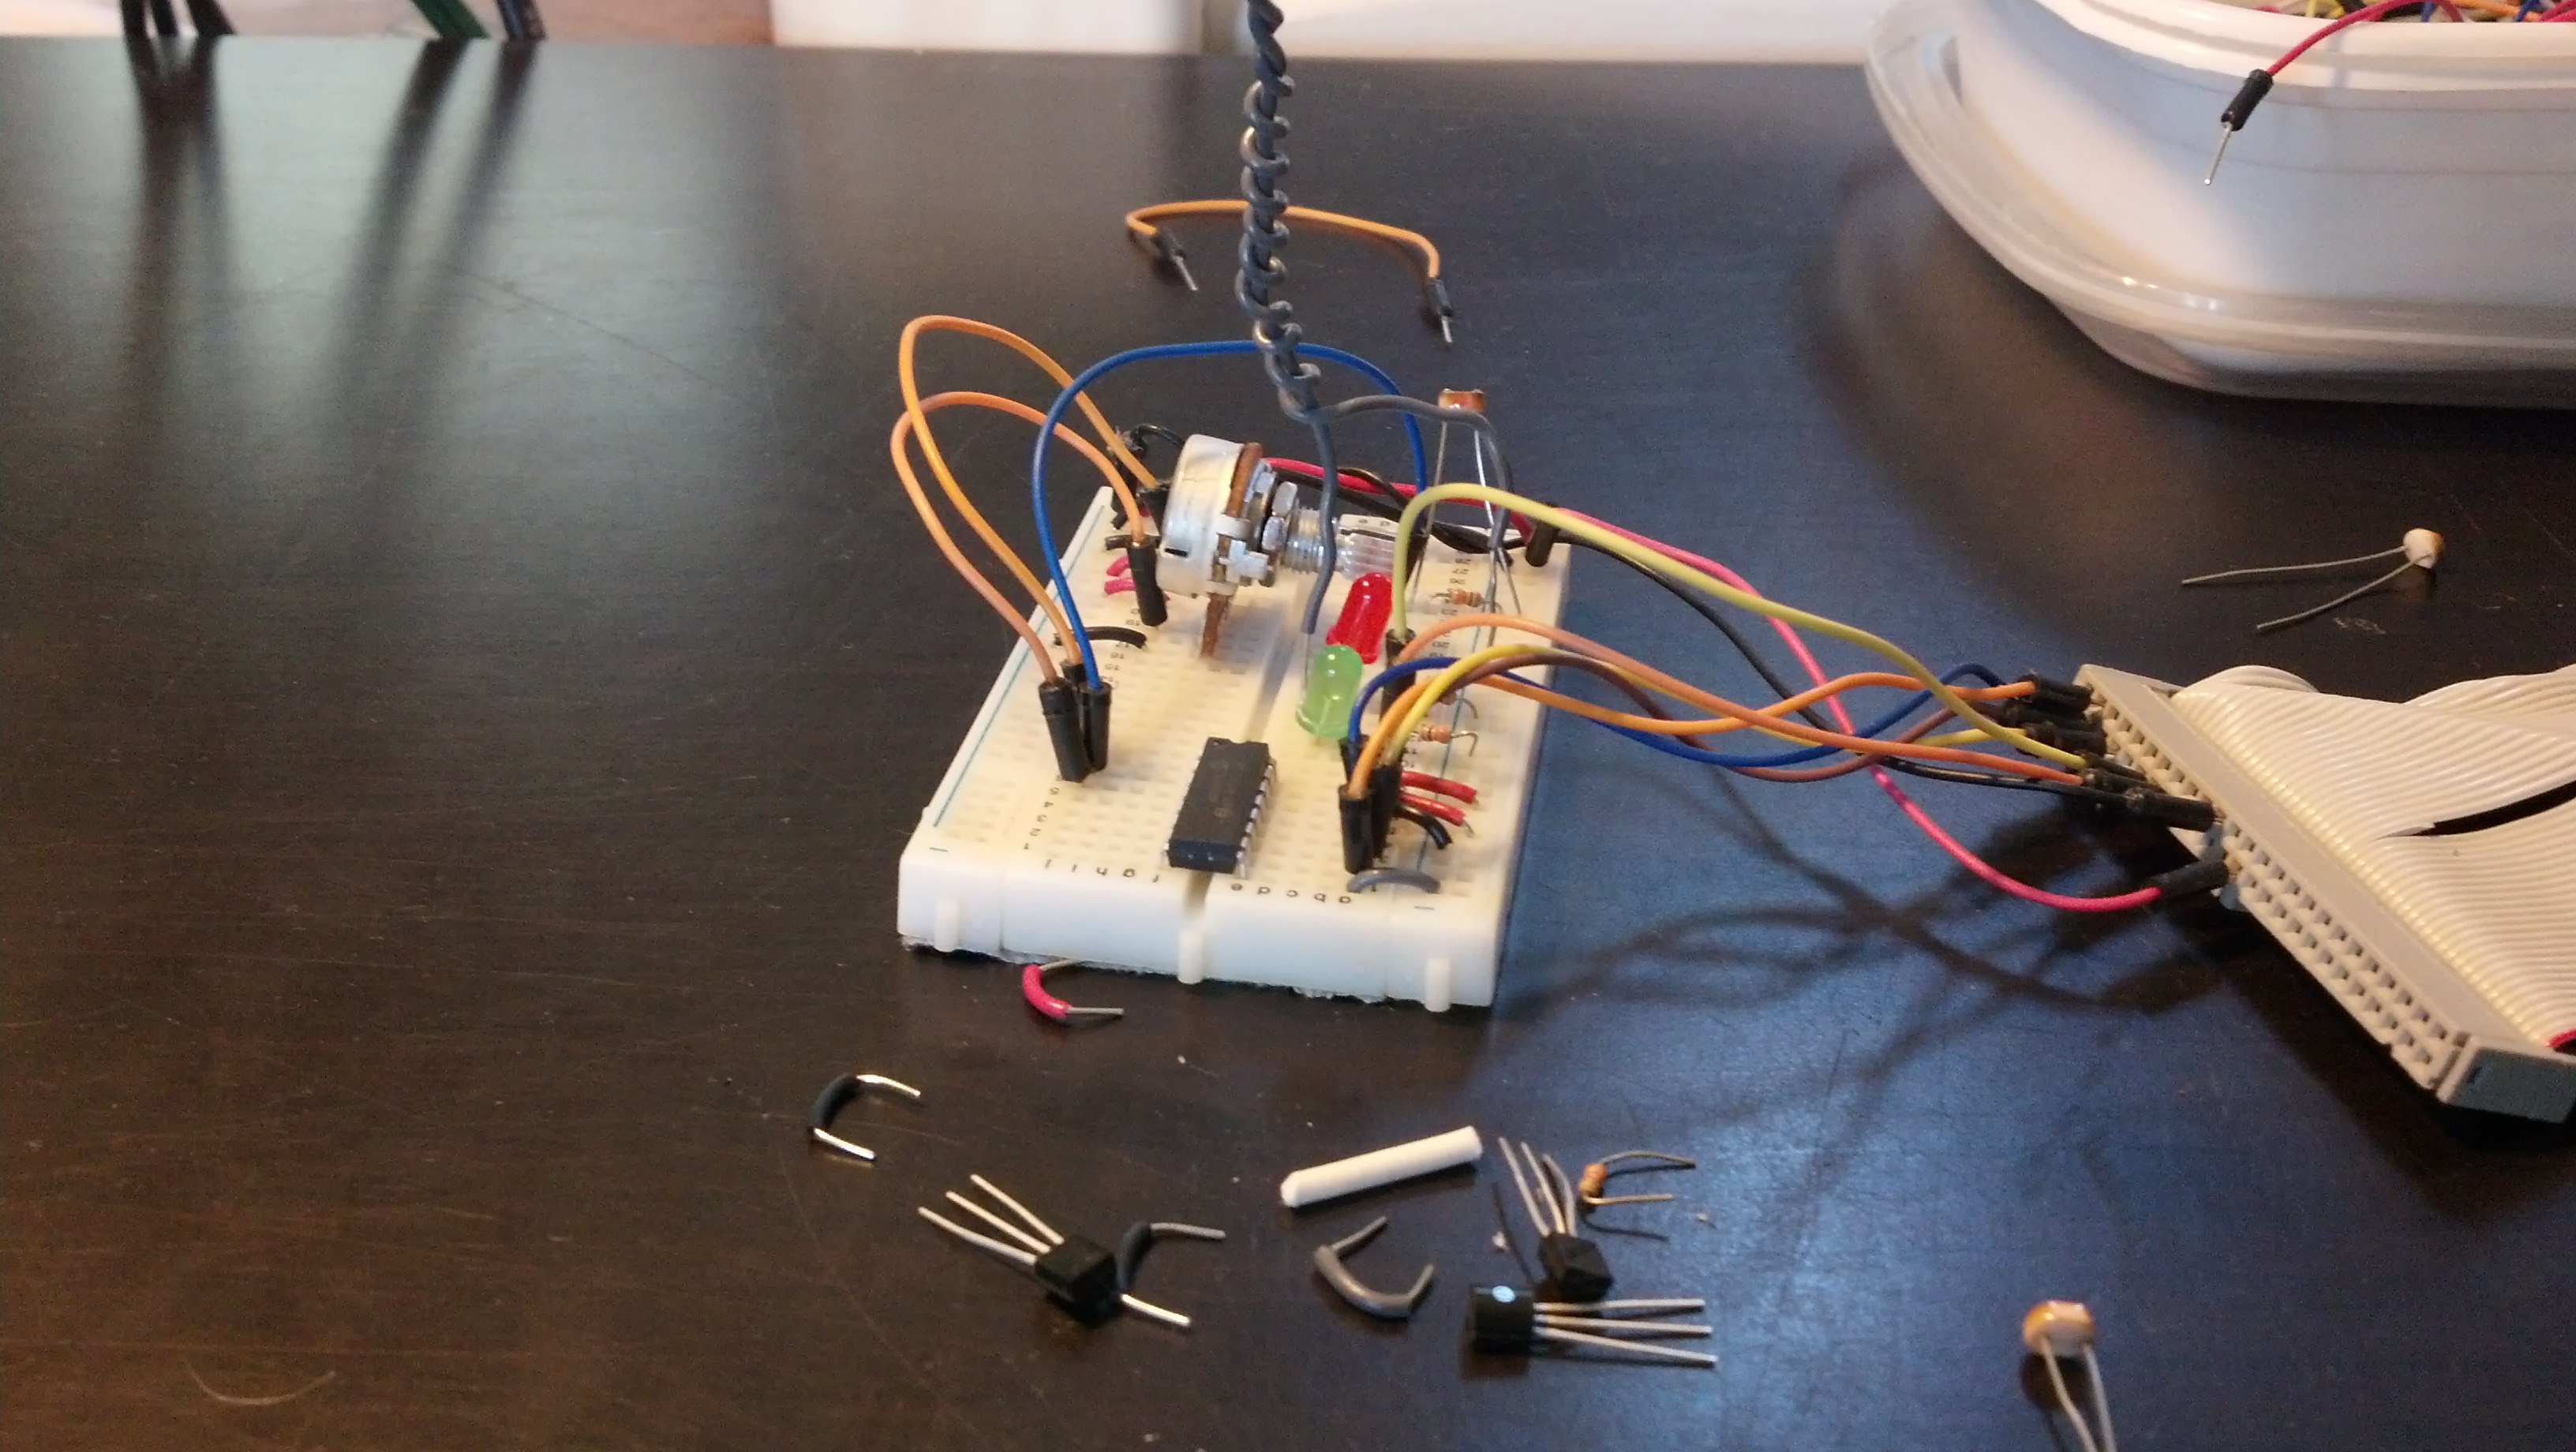
Both LED’s off
The Green LED on, the red circled process in the printout
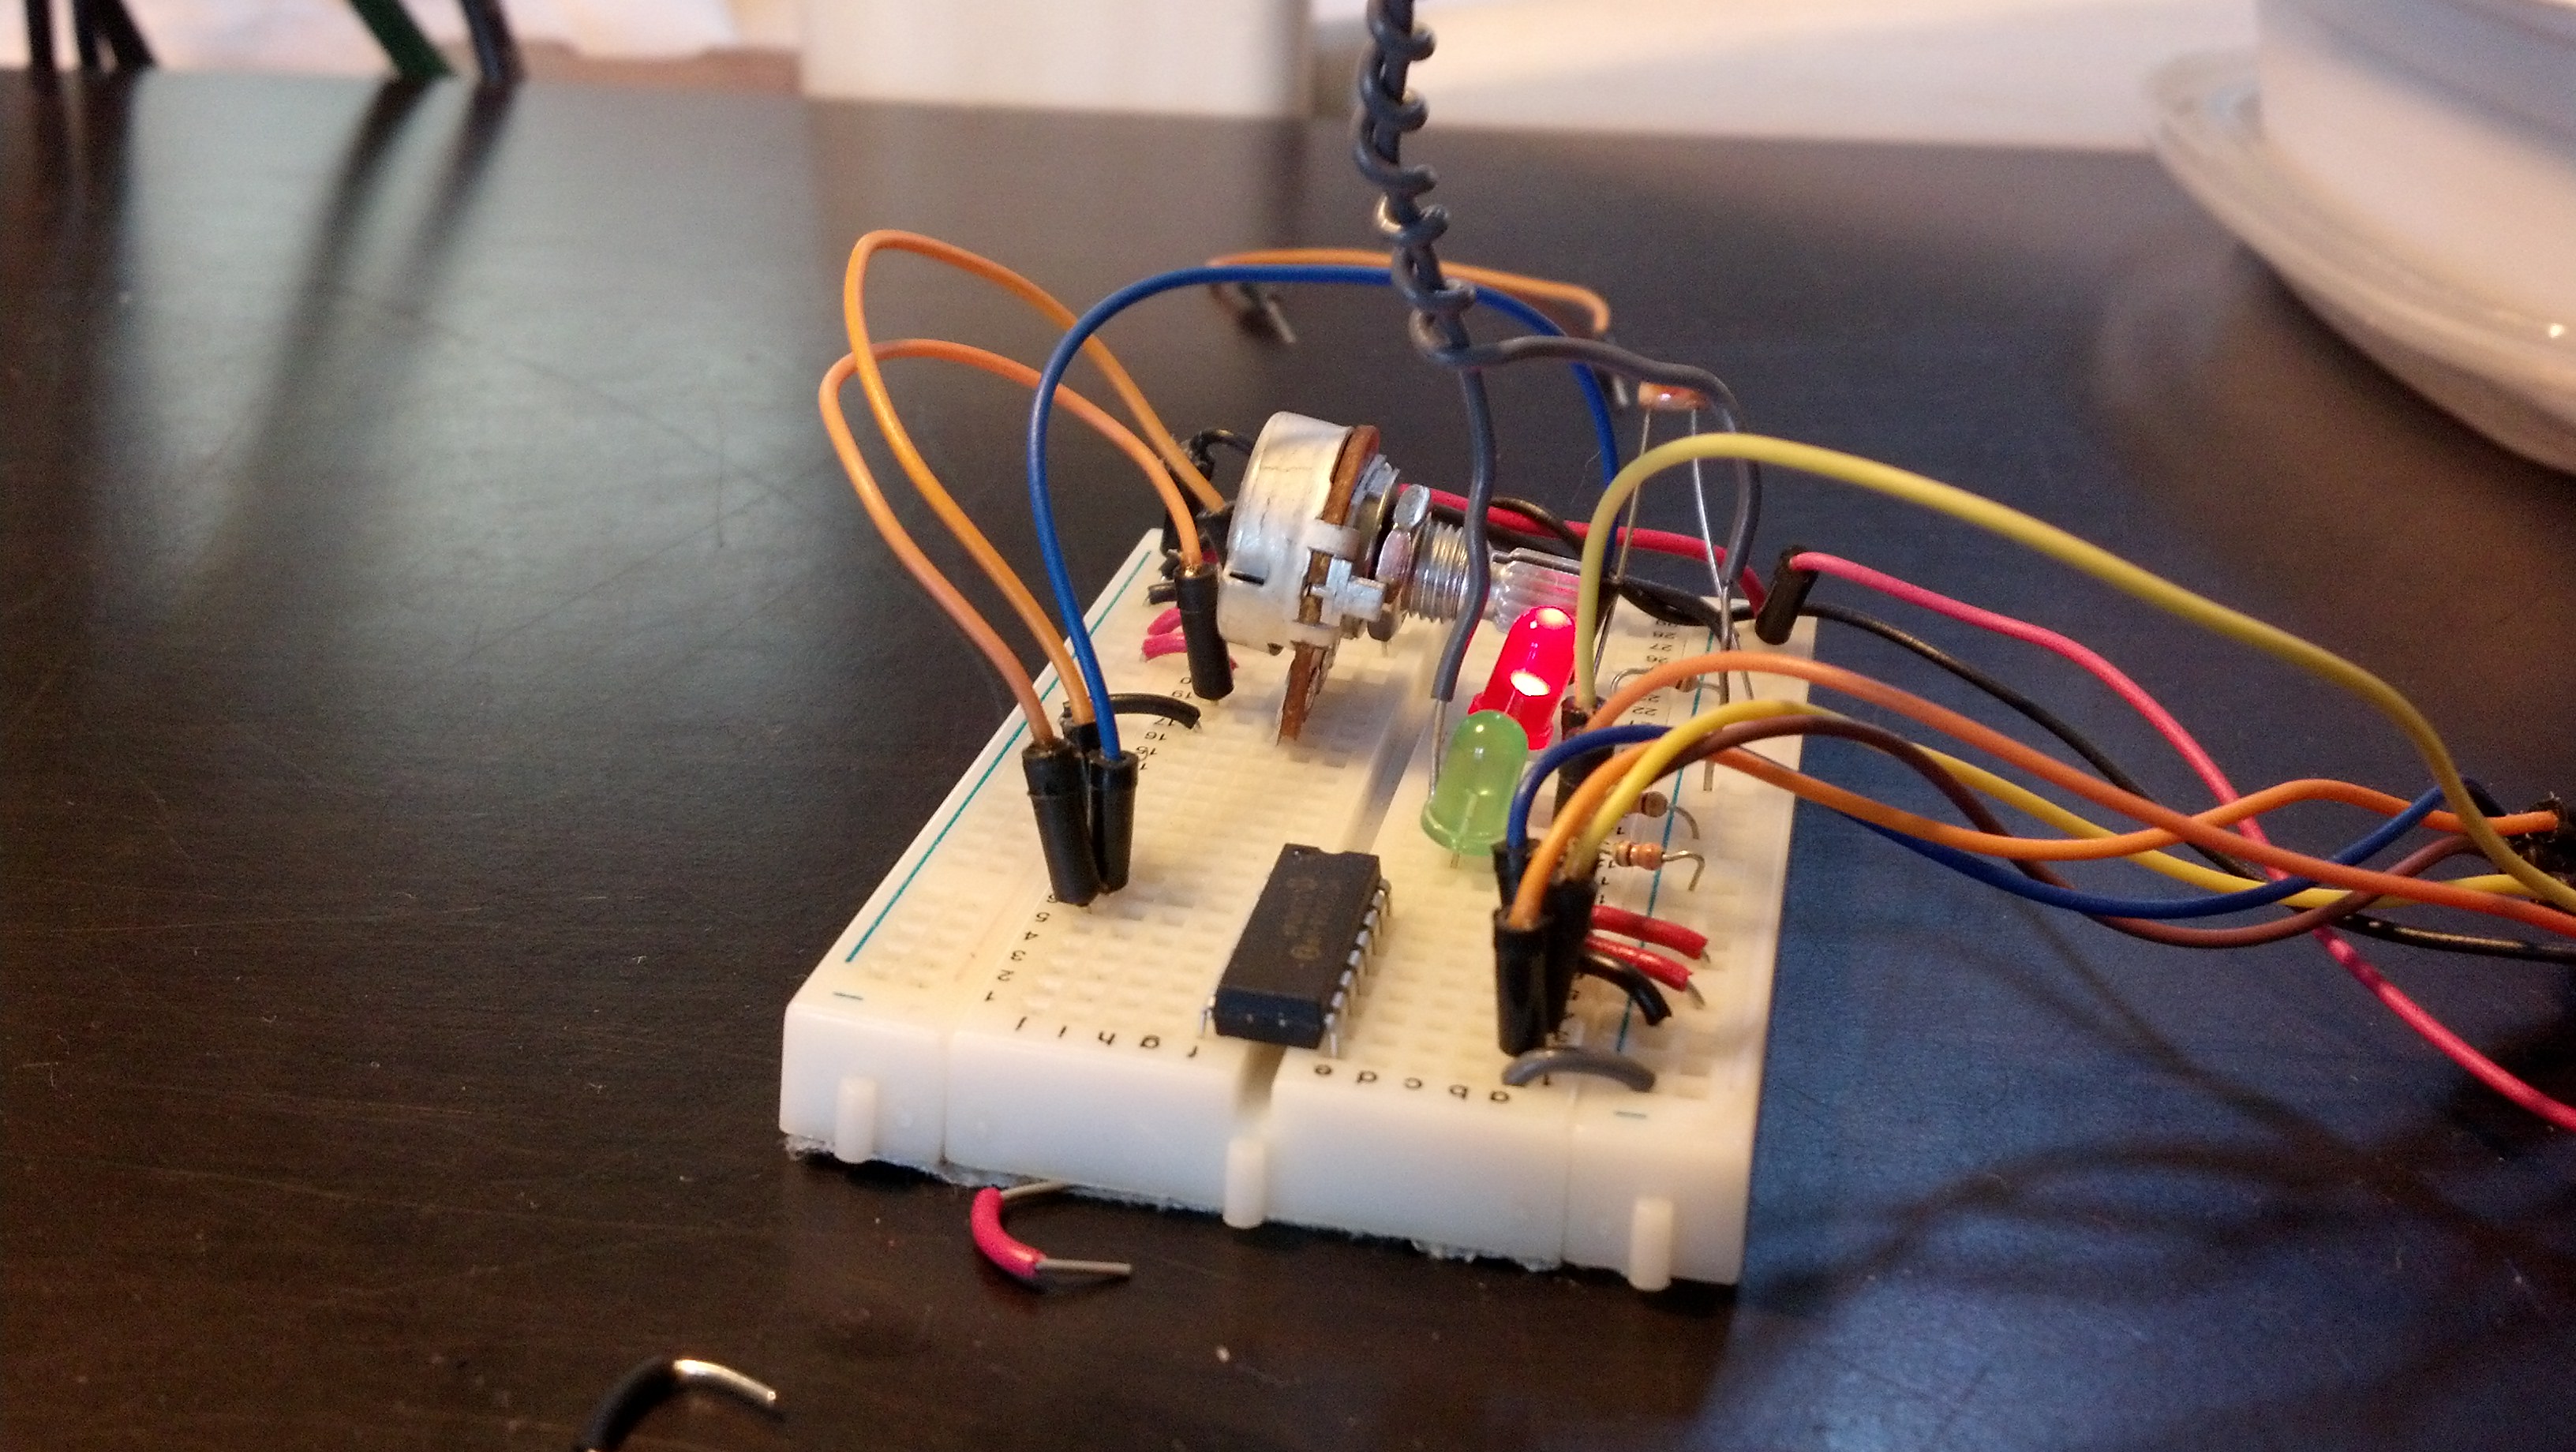
Here are both on
The next step is adding the mySQL in as seen in some other posts.