Smart Speaker | Proximity Potentiometer Proof of Concept

New project! First, here’s a video:

This is the proof of concept for the volume control of the speaker system. In it’s final form, this sensor will be exposed to the outside and will allow users to control the volume without opening the system, preserving the fidelity of the inside. For example, imagine a user is at the beach and wants to change the volume but they have sand covered hands or wet hands. This system will solve that problem.

The sensor is the Sharp GP2Y0A41SK0F. Here are some very very macro shots of sensors inner workings.

But now for what you came here for, the code. It’s very poorly commented as this is just a prototype, but it’s better than nothing. As this project progresses I’ll posted updated versions of this code.

This demo also relies heavily this shift register. I still haven’t decided if i’m going to use a buzzer to interact with the user or if I’m going to use these bar graphs.

int SER_Pin = 10;   //pin 14 on the 75HC595
int RCLK_Pin = 11;  //pin 12 on the 75HC595
int SRCLK_Pin = 12; //pin 11 on the 75HC595

//How many of the shift registers - change this
#define number_of_74hc595s 4 

//do not touch
#define numOfRegisterPins number_of_74hc595s * 8

boolean registers[numOfRegisterPins];

int detect_led = 2;

int setlevelMode0_led = 3;
int setlevelMode1_led = 4;
int setlevelMode2_led = 5;

int seeking_led = 6;

int check_val = 8;

void setup(){
  pinMode(SER_Pin, OUTPUT);
  pinMode(RCLK_Pin, OUTPUT);
  pinMode(SRCLK_Pin, OUTPUT);
  //reset all register pins
  clearRegisters();
  writeRegisters();

  pinMode(detect_led, OUTPUT);

  pinMode(setlevelMode0_led, OUTPUT);
  pinMode(setlevelMode1_led, OUTPUT);
  pinMode(setlevelMode2_led, OUTPUT);

  pinMode(seeking_led, OUTPUT);

  Serial.begin(9600);
}

int prelevel_0 = 0;
int prelevel_1 = 0;
int prelevel_2 = 0;
int prelevel_3 = 0;
int prelevel_4 = 0;
int prelevel_5 = 0;
int prelevel_6 = 0;
int prelevel_7 = 0;
int prelevel_8 = 0;
int prelevel_9 = 0;

int pre_positions[10] = {prelevel_0, prelevel_1, prelevel_2, prelevel_3, prelevel_4, prelevel_5, prelevel_6, prelevel_7, prelevel_8, prelevel_9};

void loop(){
  for(int i = 0; i <= 9; i = i + 1){
    writebargraph(0,map(analogRead(0),20,600,0,9));
    pre_positions[i] = map(analogRead(0),20,600,0,9);
    if(pre_positions[i] == check_val){
      Serial.println("Check Detected");
      digitalWrite(detect_led, HIGH);
    }
    else {
     digitalWrite(detect_led, LOW);
    }
    delay(30);
  }
  for(int i = 0; i <= 9; i = i + 1){
    Serial.print(pre_positions[i]);
    Serial.print(",");
  } 

  if (pre_positions[0] == check_val && pre_positions[1] == check_val && pre_positions[2] == check_val && pre_positions[3] == check_val && pre_positions[4] == check_val && pre_positions[5] == check_val && pre_positions[6] == check_val && pre_positions[7] == check_val && pre_positions[8] == check_val && pre_positions[9] == check_val  ){
    Serial.print(" - Pre Level Set");
    Serial.println("");
    delay(500);
    setlevel();
    delay(500);
  }
  else {
    Serial.println(" - No Set");
  }

}

//set all register pins to LOW
void clearRegisters(){
  for(int i = numOfRegisterPins - 1; i >=  0; i--){
     registers[i] = LOW;
  }
} 

//Set and display registers
//Only call AFTER all values are set how you would like (slow otherwise)
void writeRegisters(){
  digitalWrite(RCLK_Pin, LOW);
  for(int i = numOfRegisterPins - 1; i >=  0; i--){
    digitalWrite(SRCLK_Pin, LOW);
    int val = registers[i];
    digitalWrite(SER_Pin, val);
    digitalWrite(SRCLK_Pin, HIGH);
  }
  digitalWrite(RCLK_Pin, HIGH);
}

//set an individual pin HIGH or LOW
void setRegisterPin(int index, int value){
  registers[index] = value;
}

void writebargraph(int set, int led){
  if(set == 0){
    for(int i = 0; i <= 9; i = i + 1){
      if(i <= led){

        setRegisterPin(i, HIGH);
        writeRegisters();
      }
      else if(i > led){

        setRegisterPin(i, LOW);
        writeRegisters();
      }
     }
   }
  if(set == 1){
    for(int k = 10; k <= 29; k = k + 1){
      if(k <= 10 + led){
        setRegisterPin(k, HIGH);
        writeRegisters();
      }
      else if(k > 10 + led){
        setRegisterPin(k, LOW);
        writeRegisters();
      }
    }
  }

}

void setlevel(){

  int level0 = 0;
  int level1 = 0;
  int level2 = 0;
  int level3 = 0;
  int level4 = 0;
  int level5 = 0;
  int level6 = 0;
  int level7 = 0;
  int level8 = 0;
  int level9 = 0;
  int level10 = 0;
  int level11 = 0;
  int level12 = 0;
  int level13 = 0;
  int level14 = 0;
  int level15 = 0;
  int level16 = 0;
  int level17 = 0;
  int level18 = 0;
  int level19 = 0;
  int level20 = 0;
  int level21 = 0;
  int level22 = 0;
  int level23 = 0;
  int level24 = 0;
  int level25 = 0;
  int level26 = 0;
  int level27 = 0;
  int level28 = 0;
  int level29 = 0;

  int positions[30] = { level0, level1, level2, level3, level4, level5, level6, level7, level8, level9, level10, level11, level12, level13, level14, level15, level16, level17, level18, level19, level20, level21, level22, level23, level24, level25, level26, level27, level28, level29};

  digitalWrite(setlevelMode1_led, LOW);
  digitalWrite(setlevelMode2_led, LOW);  

  boolean seeking = true;

  while(seeking == true){
    for(int i = 0; i <= 29; i = i + 1){
      writebargraph(1,map(analogRead(0),20,600,0,19));
      positions[i] = map(analogRead(0),20,600,0,19);
      Serial.print(positions[i]);
      Serial.print(",");
      delay(10);
    }  

  if (positions[0] == positions[0] && positions[1] == positions[0] && positions[2] == positions[0] && positions[3] == positions[0] && positions[4] == positions[0] && positions[5] == positions[0] && positions[6] == positions[0] && positions[7] == positions[0] && positions[8] == positions[0] && positions[9] == positions[0] && positions[10] == positions[0] && positions[11] == positions[0] && positions[12] == positions[0] && positions[13] == positions[0] && positions[14] == positions[0] && positions[15] == positions[0]  ){
     Serial.print(" - Level Set");
     digitalWrite(setlevelMode1_led, HIGH);
     seeking = false;
   }

   else {
     Serial.print(" - No Set");
     digitalWrite(setlevelMode1_led, LOW);
   }

   Serial.println("");

  }

}

Here are some photos of the board if you want to try and work out the schematic:

PiPlanter 2 | Little Plants 1 / Germination Setup

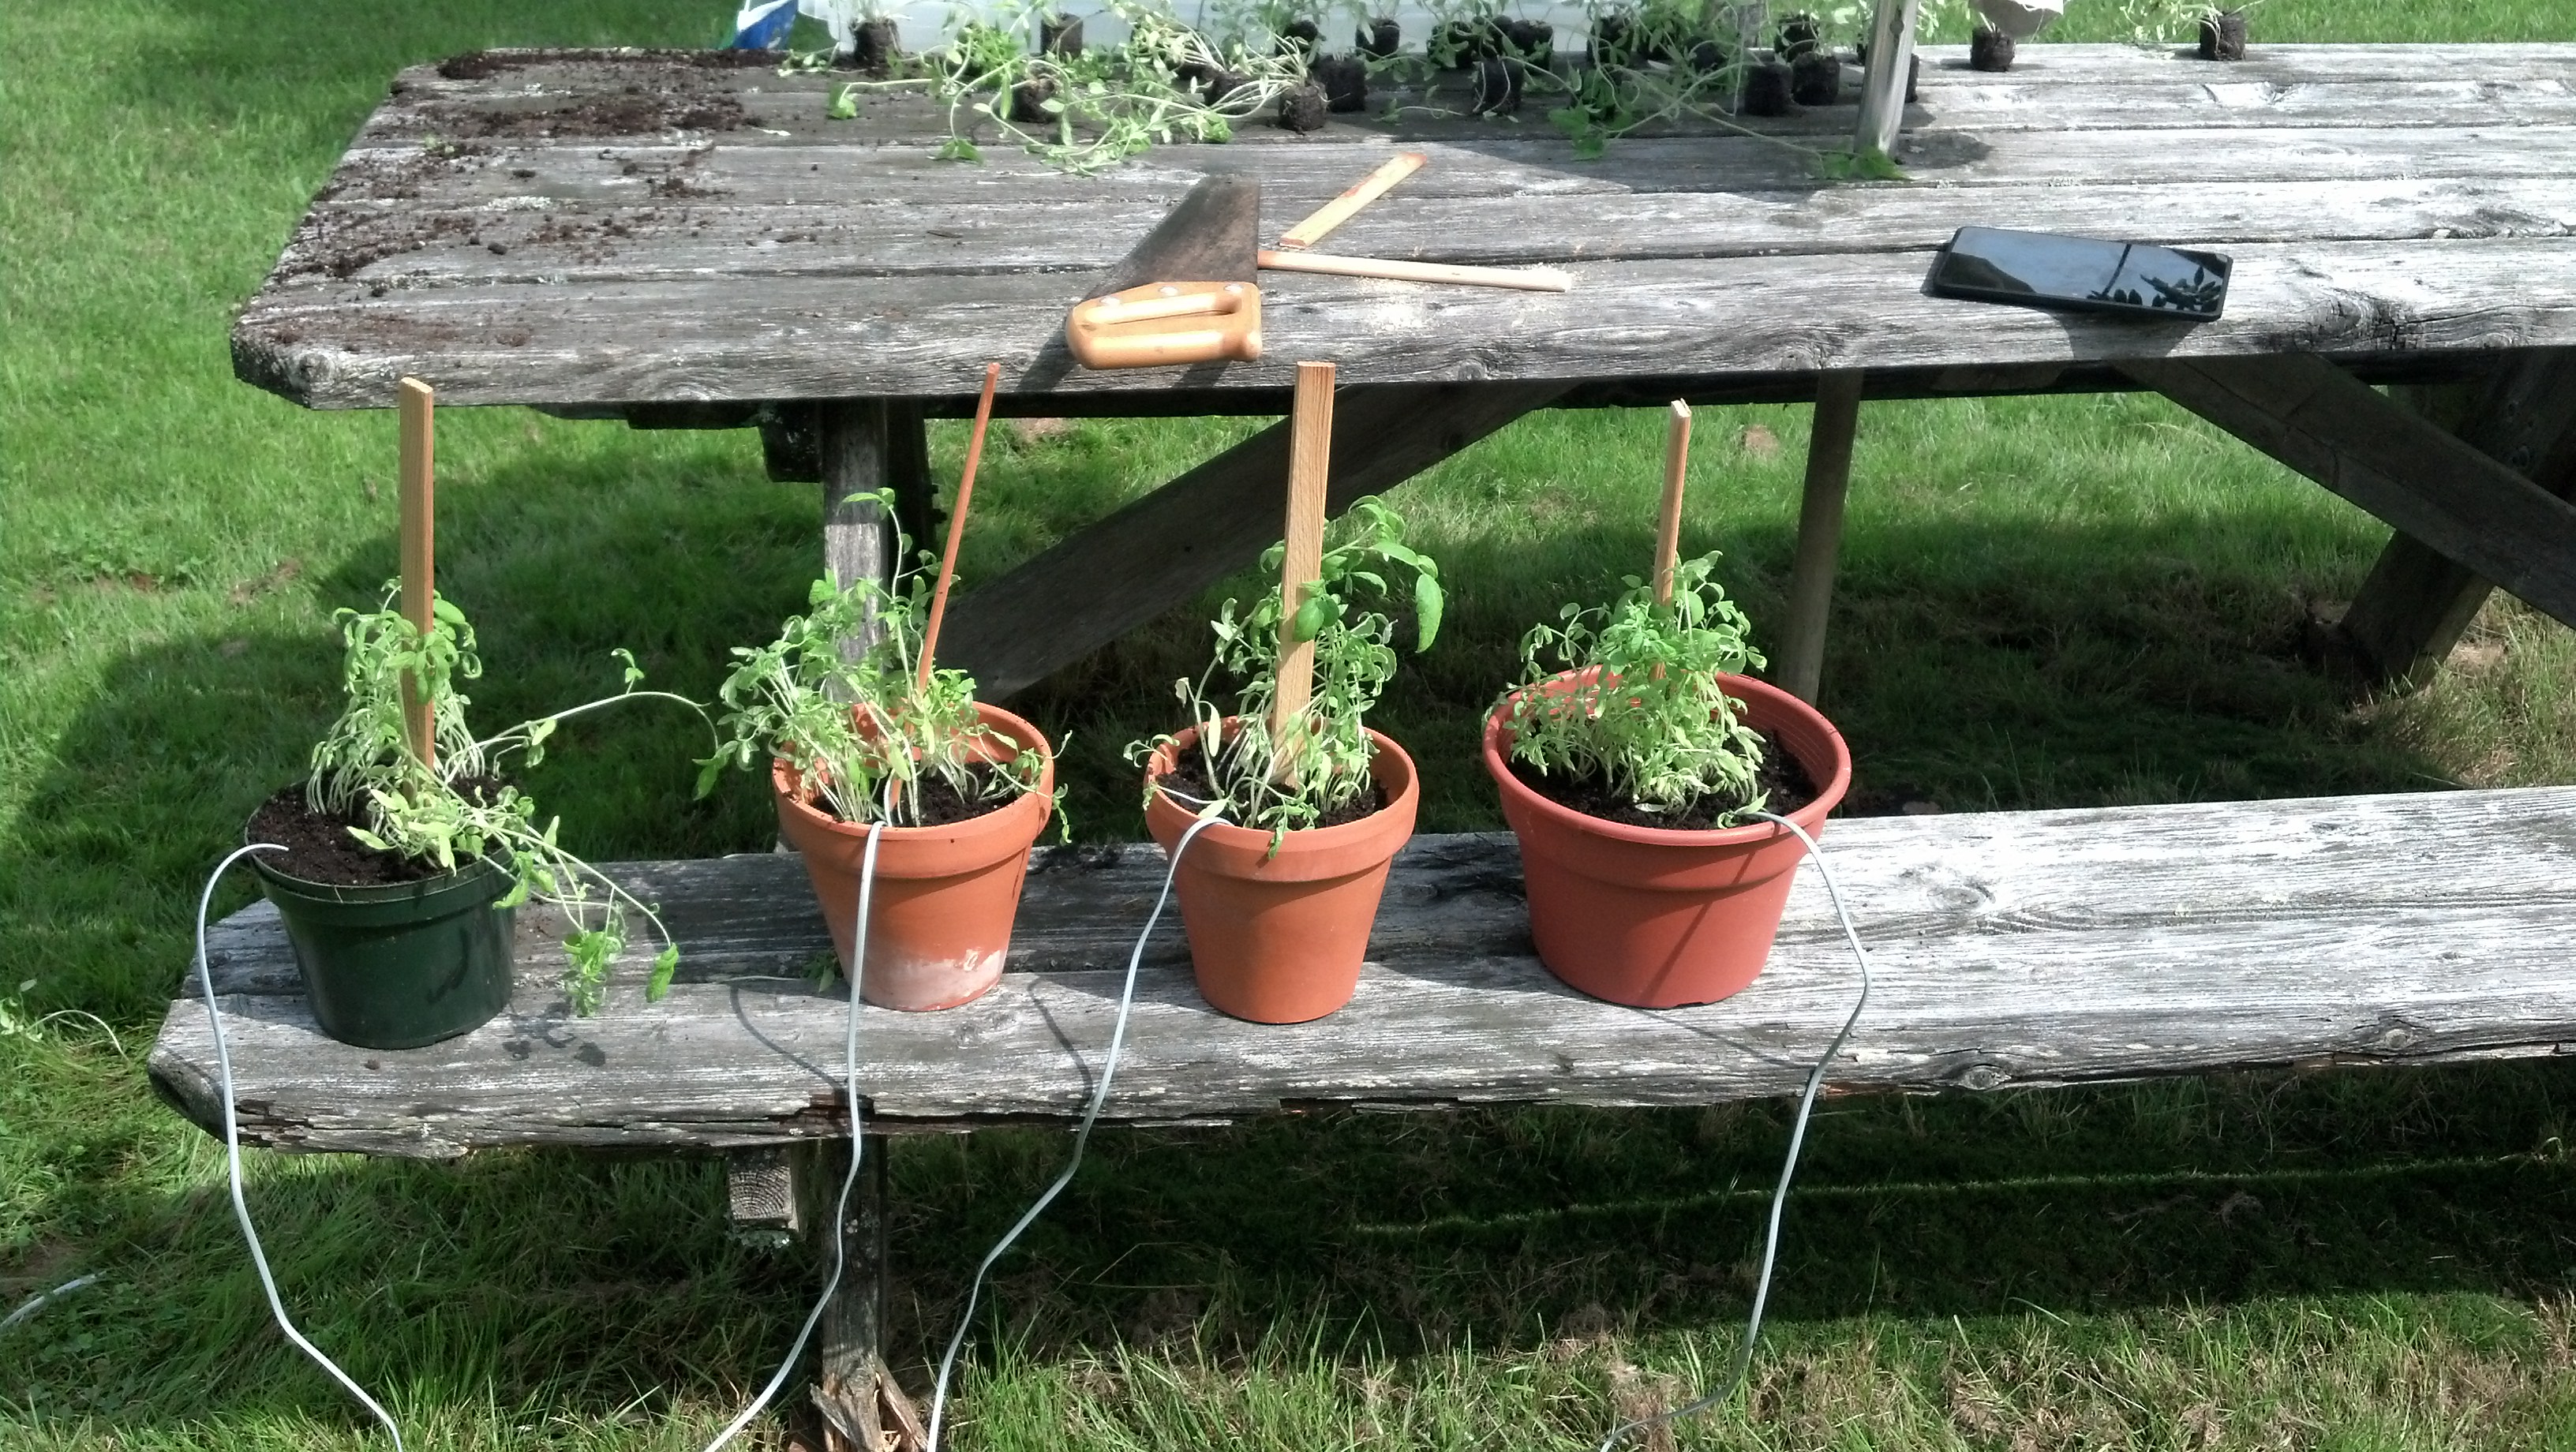
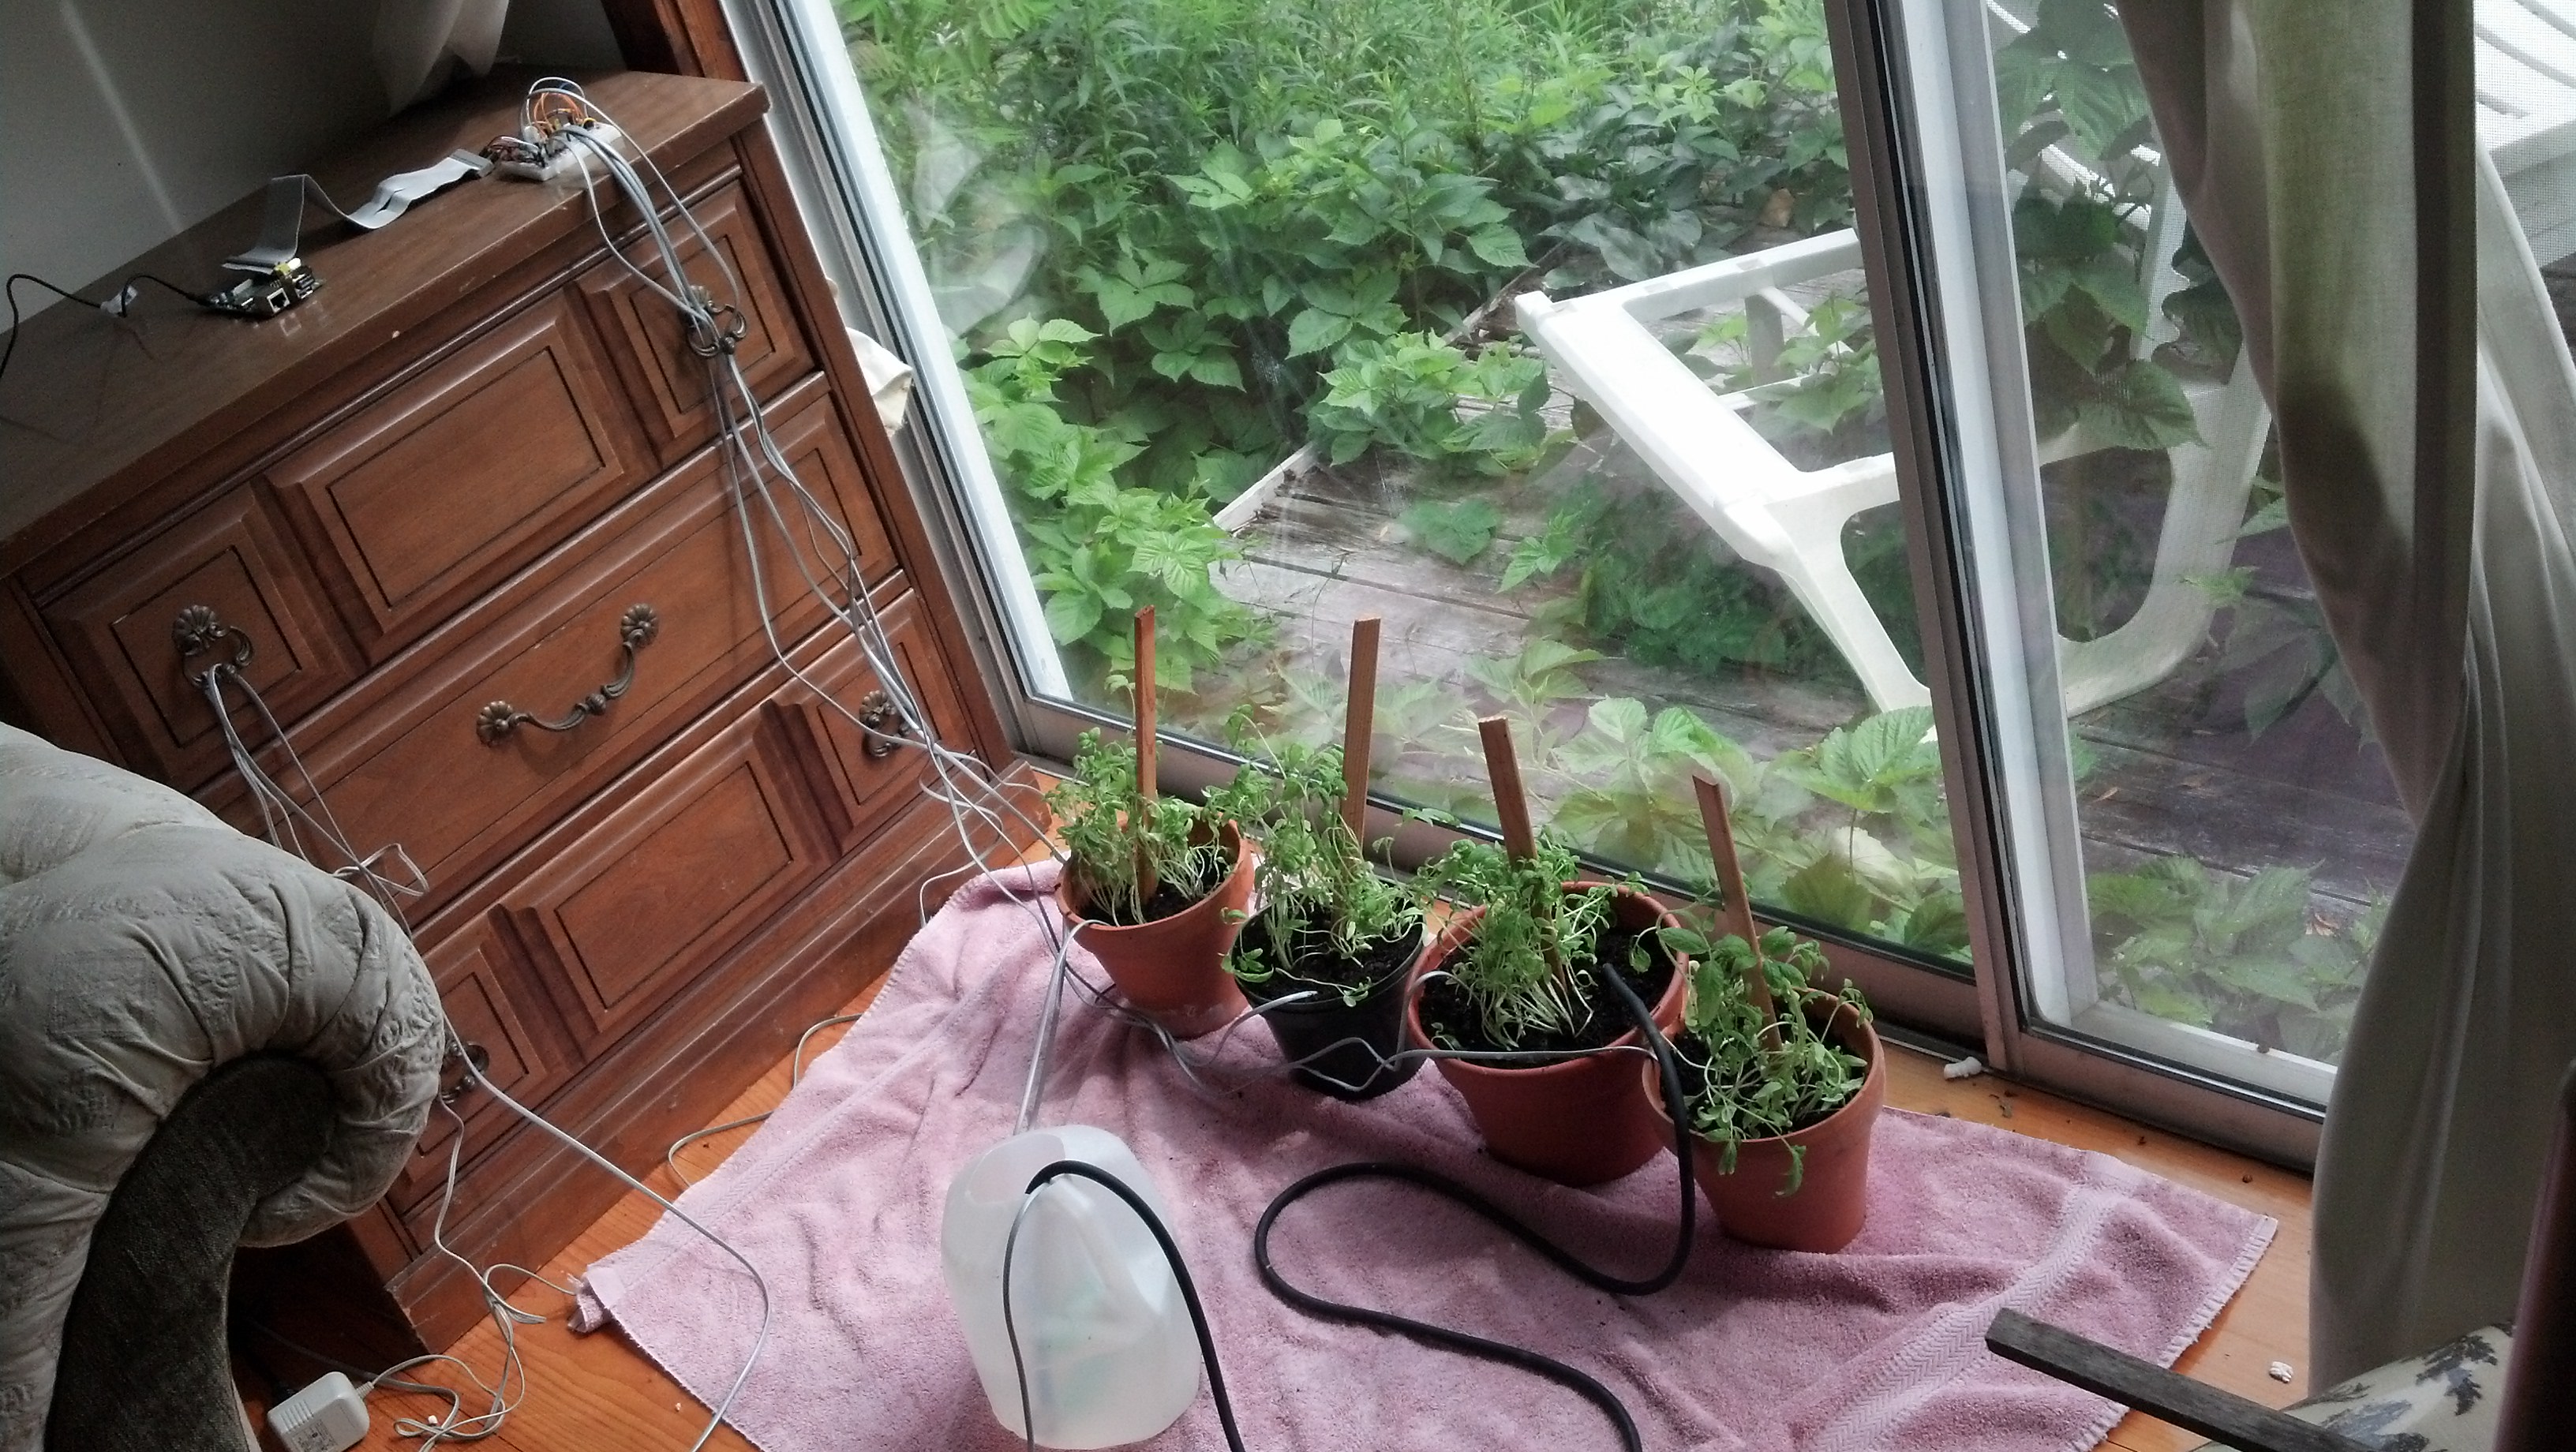
The plants are coming along quite nicely, here is an album of images:

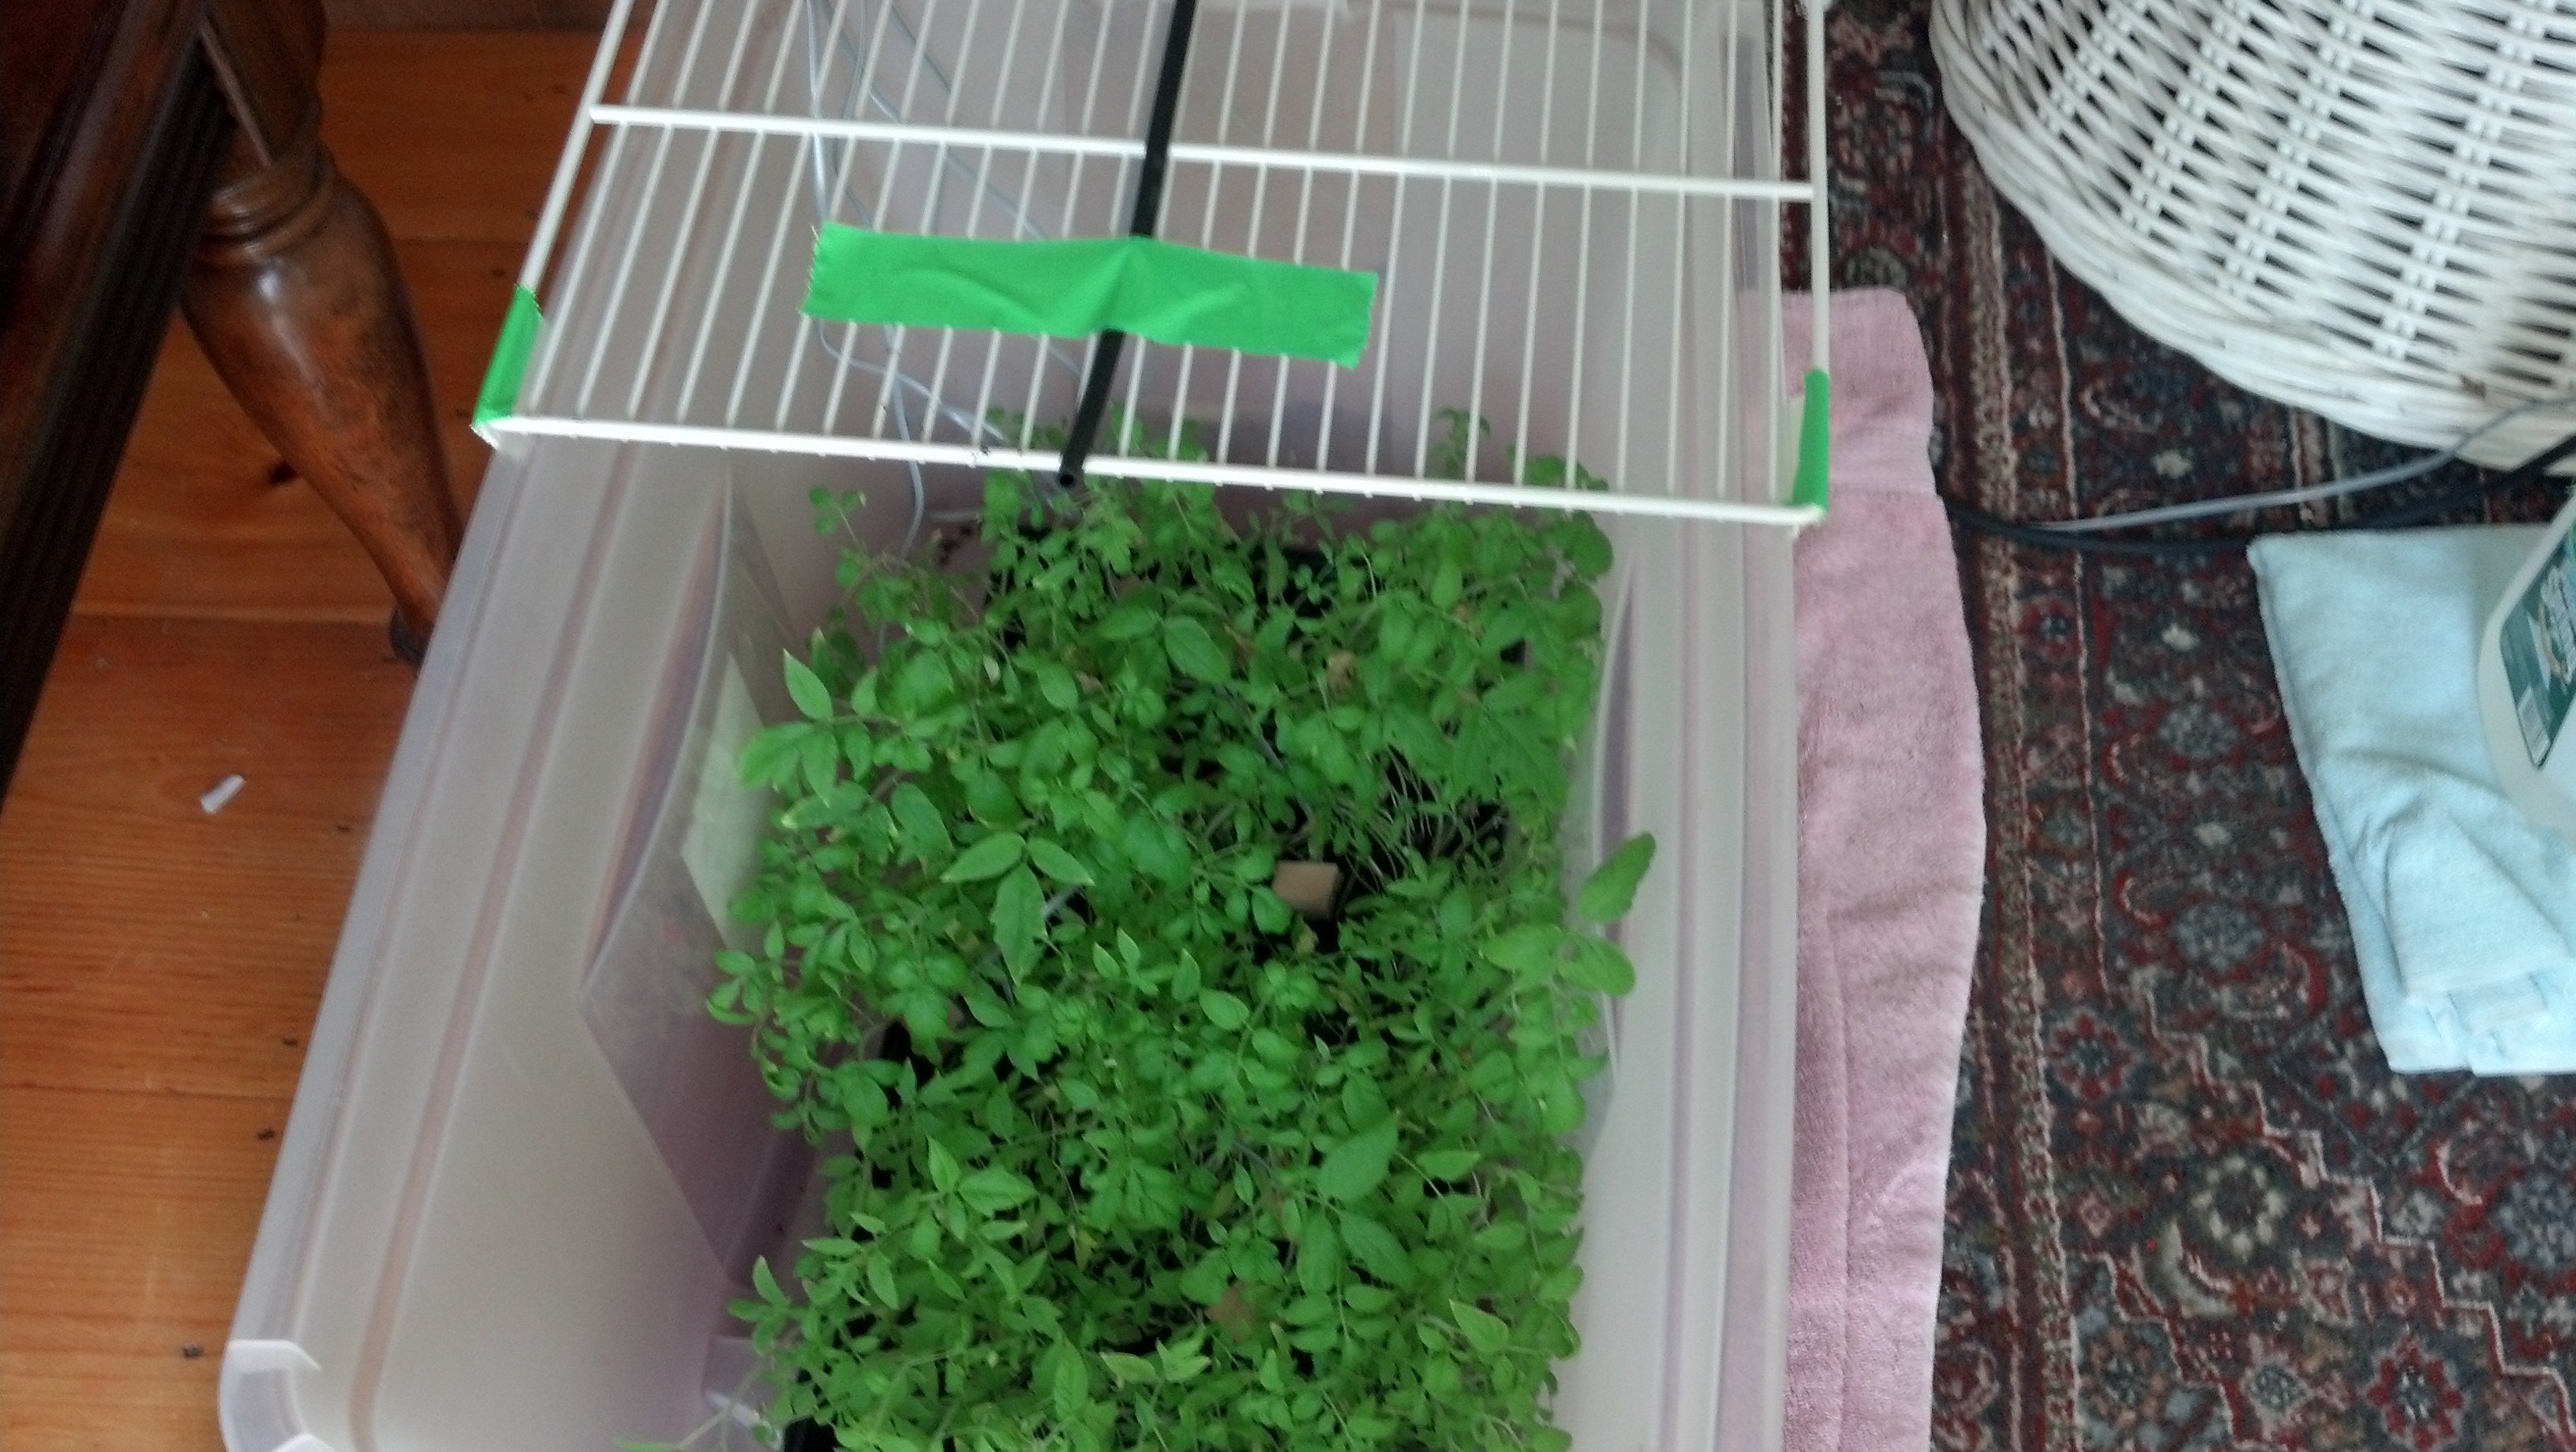
As for my grow setup in this stage, it’s pretty simple. Basically I keep the two desk lamps I have from that area on 24/7 and on the plants. Every morning I put about a half gallon into each of the trays. I also spray about 8oz onto the surface of the plants. Working pretty well so far, all of this growth is only after a week and two days.

PiPlanter 2 | Update / Dirt / Germs

Hi! In order to do PiPlanter 2 at the scale I want, as always, I need money. I’m applying to this grant to hopefully take this project to unreal new heights. In order to apply, one of the component is assembling a budget. In order to do that though, I need to “complete” the whole project… in my head. I have to be able to think of exactly how I want to do the project. From PCB design to pump system, I have to plan it all in order to assemble a realistic budget. There is a lot of good work that comes with this, like schematics and the budget itself. I’ll for sure upload all of the documentation.

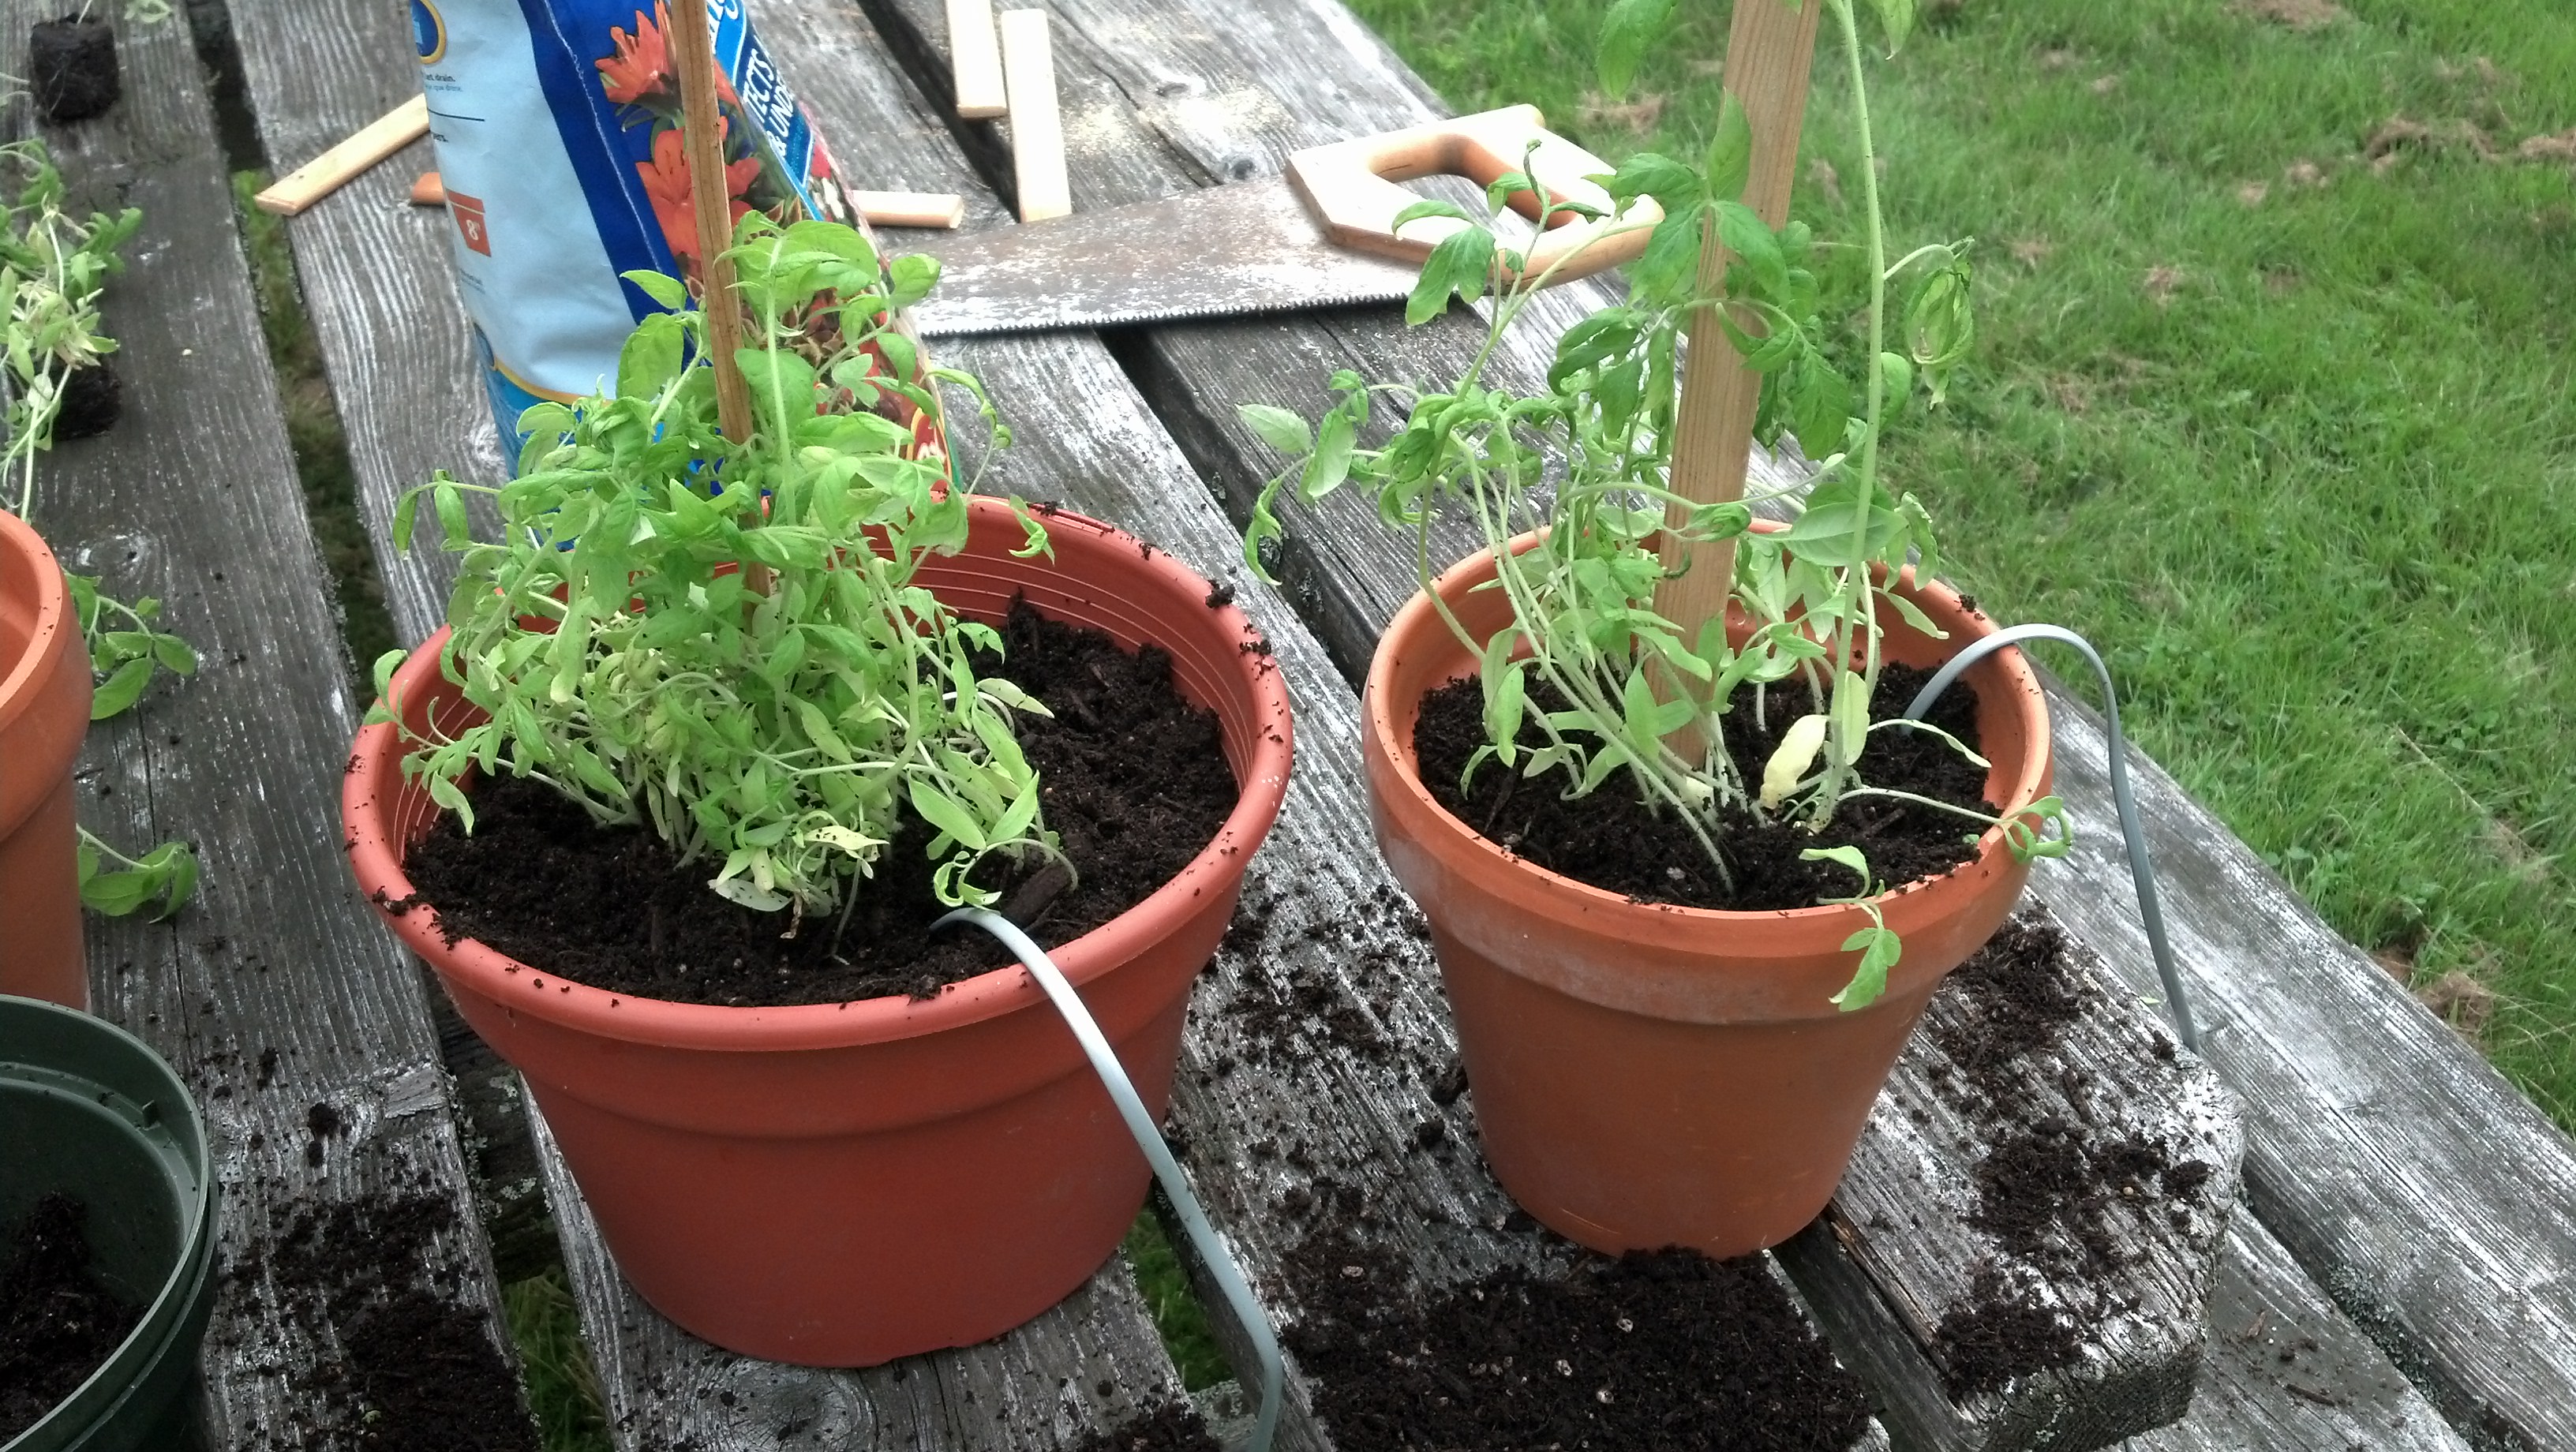
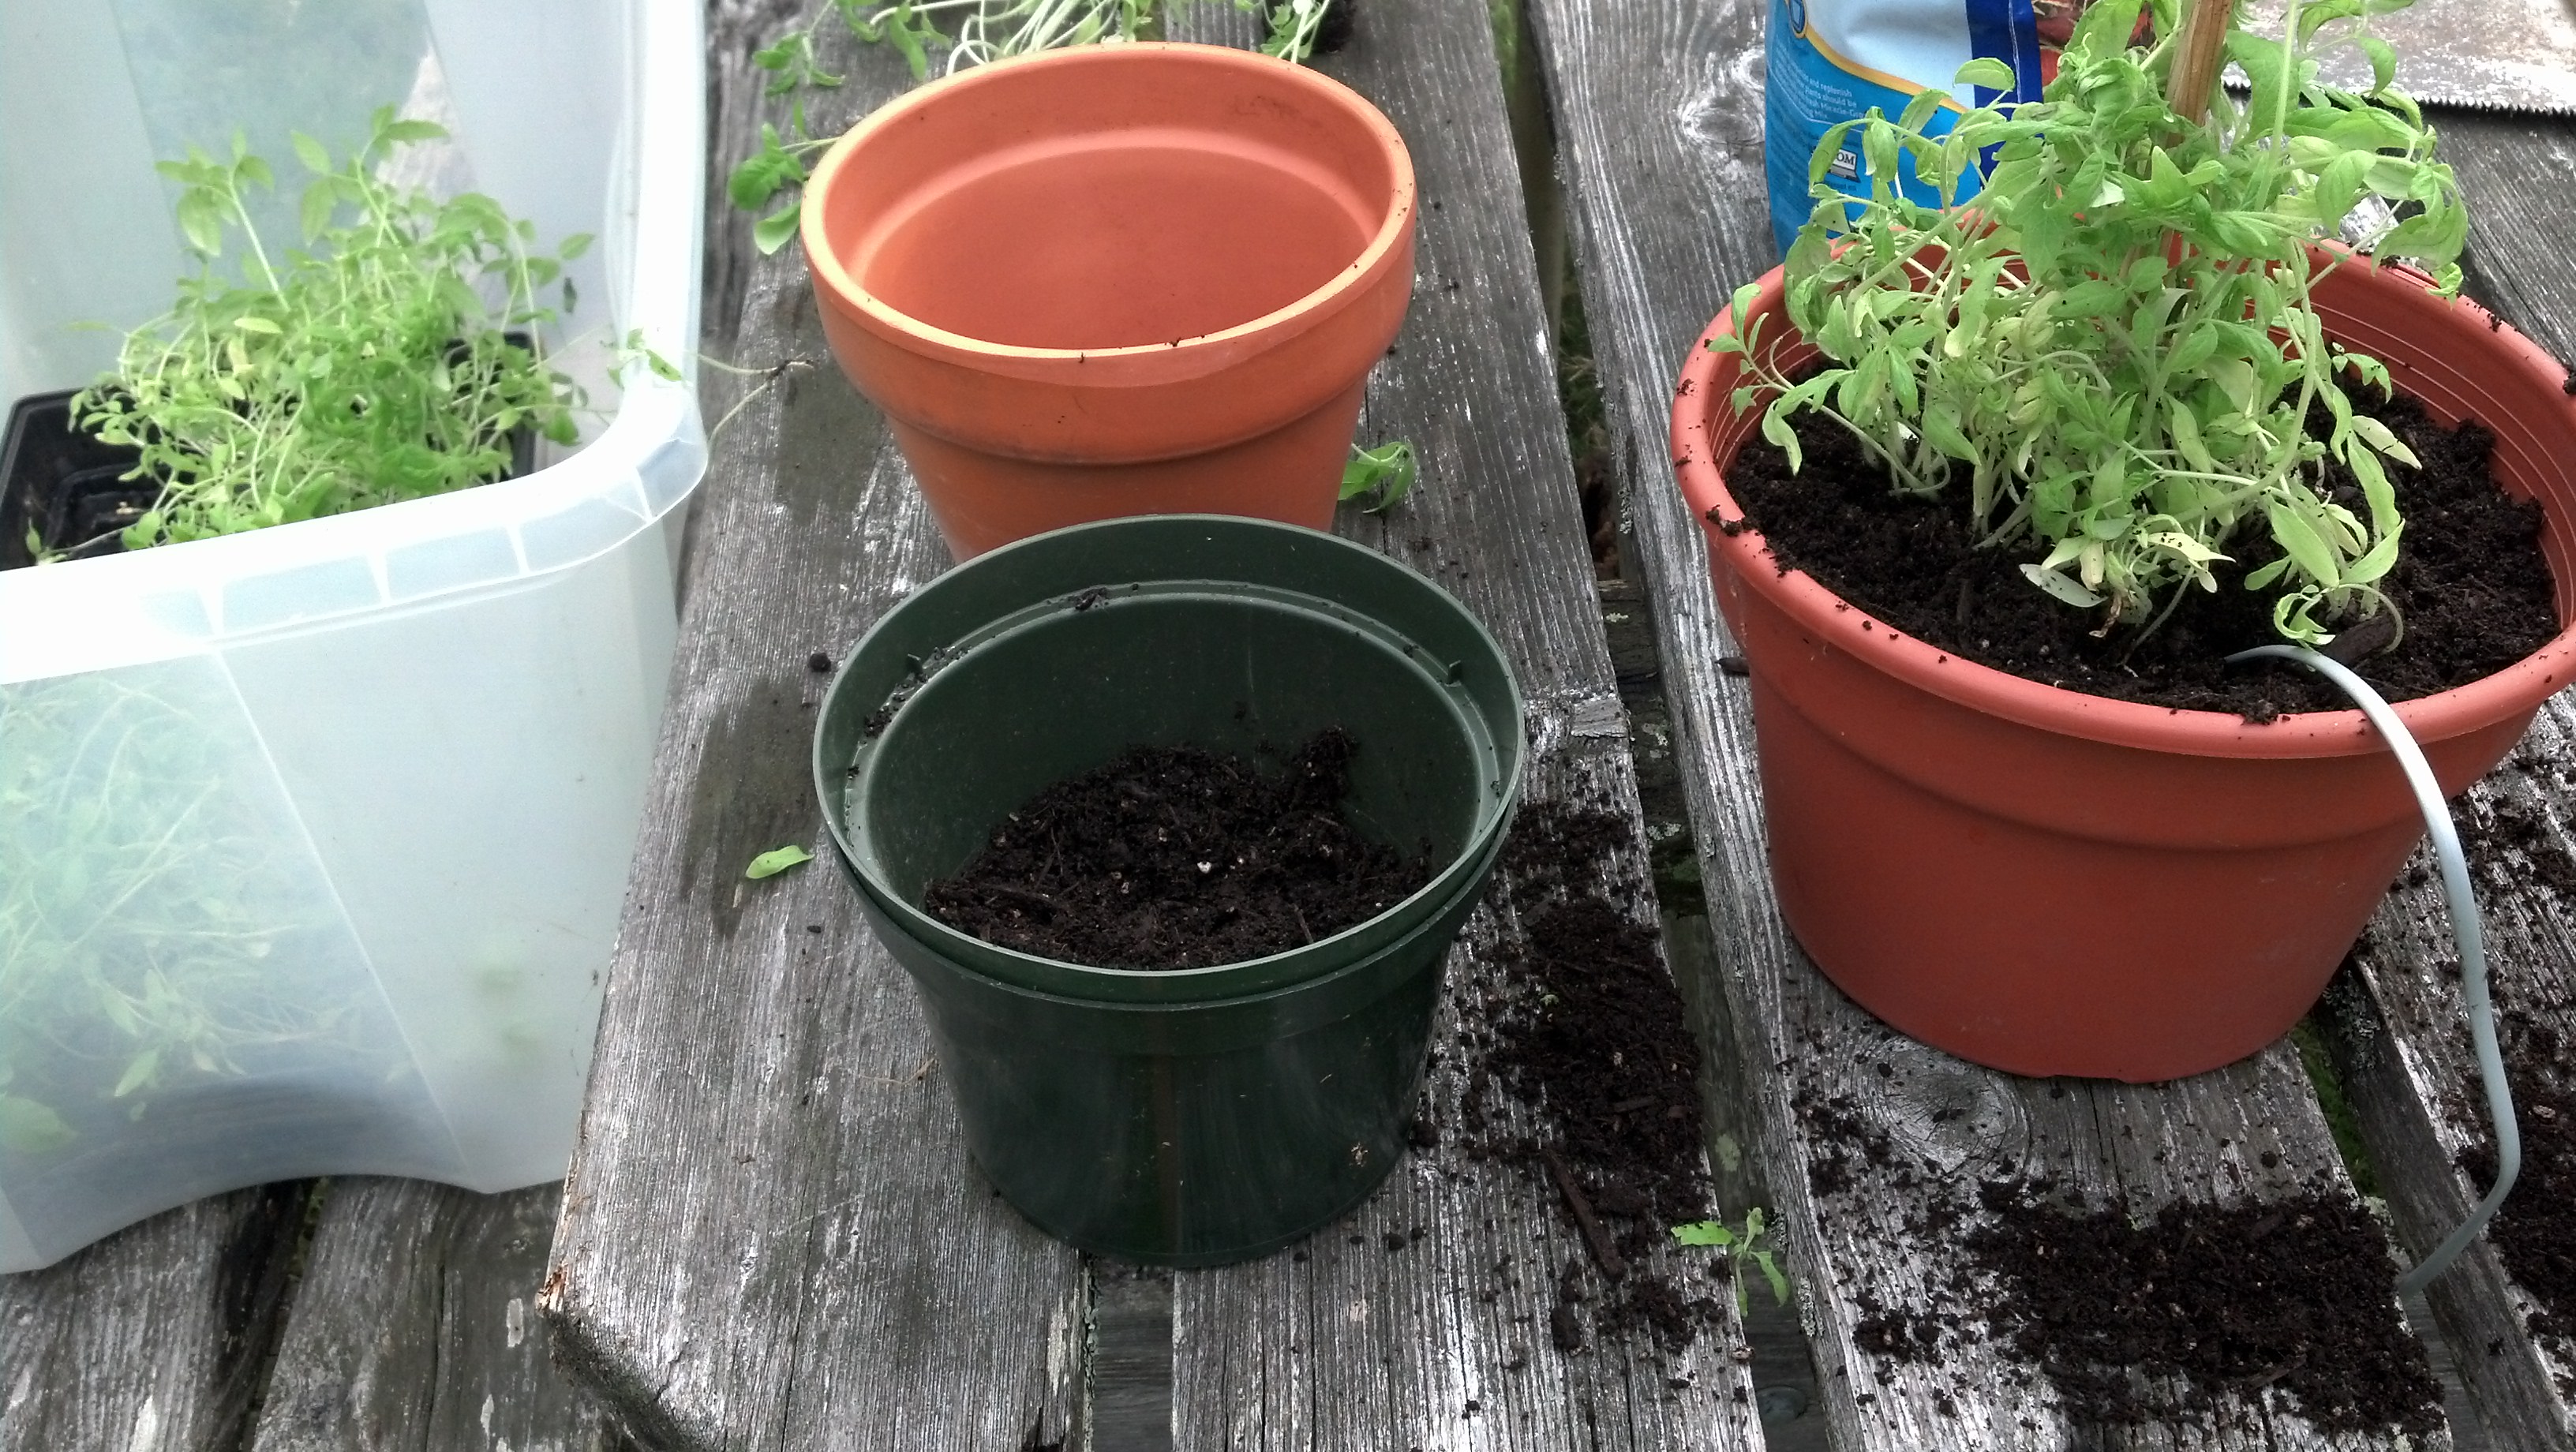
On a more stimulating note: I’ve planted the tomato plants in the same manor that I did last summer and here are some pictures of the growth so far.

Here is the dirt and planted seeds:

Here are some very small sprouts that have developed in the last two days.

PiPlanter 2 | Getting Started Again

So I have decided to re write the PiPlanter from the ground up. In essence, it will accomplish the same exact thing but I’d like it to be a lot more of a stable platform to expand upon in the future. I’d also like PiPlanter to be professional enough to bring to market. First off there are a few things you’d need install & a few modifications you’d need to make to Raspian. First thing’s first, you’ll need to enable SPI in the kernel so:

sudo vi /etc/modprobe.d/raspi-blacklist.conf

Comment out the spi-bcm2708 line so it looks like this:

#blacklist spi-bcm2708

Then run this to make it more permanent.

sudo modprobe spi-bcm2708

Now for the real meat of it. You’ll need these packages for SPI and the WiringPi library makes things a whole lot easier for us. This program also relies very heavily

sudo apt-get install python-imaging python-imaging-tk python-pip python-dev git
sudo pip install spidev
sudo pip install wiringpi
sudo apt-get install apache2
sudo apt-get install mysql-server
sudo apt-get install php5
sudo apt-get install php5-mysql
sudo pip install tweepy</pre>
<pre style="color: #333333;">sudo pip install apscheduler</pre>
<pre>

Revised python code next post.

PiPlanter | Goals and changes

So I am 151 miles away from the PiPlanter. But thanks to the internet, modern day routers, and wifi dongles I can pretty much control everything about it from here.

That being said, there are a few things I would like to change about the project. First of all, the program itself needs to be more modular. Reason being is that the core program should never stop running, even if changes need to be made. I should be able to screen the main program once, and then never have to stop it ever. This would be advantageous in a few ways but the main example is that the plants will require more water as they get larger, and then less once they start yielding fruit. I could script this, but I think that it would be best to be able to edit the ‘ontime’ value from the program without having to stop the whole process.

I’ll keep y’all posted as I try to implement this.

Multiple Project Update

Hi guys

So I’ve been eeking out all that I can of my last few days of summer, and there hasn’t been much rain or bad weather at all. As a result, I’m not posting much at all.

Doesn’t mean I’m not working though, I’ve been doing a couple things.

First thing’s first my speaker is done. I just need to get a bunch of video edited, and a big post written.

Secondly I’m still working really hard on my dead simple flickr uploader (dsfu). The cool thing about this project is that it has the potential to be very useful to quite a number of people, so I’m trying to make sure that it is very stable, and very easy to duplicate. This means for the most part I’ve been doing a series of 4000+ photo uploads trying to break my script. It’s happened a lot, and you can check my twitter feed to see my brain melt as I try and figure out the problem. This project won’t necessarily be “complete” until I have a 3D printer at my disposal to create the enclosure I want.

As for the PiPlanter, it’s still a work in progress. The update I did with my last post was a start to something really complete it is in no way finished. I still need to move the camera, and the plants.

Thanks for reading!

PiPlanter | Big Overhaul Update

Okay! So I leave for college in less than 30 days, but I’d like to make sure my tomatoes to continue to grow once I leave so I’ve taken some steps to make sure that my departure goes smoothly.

Here’s a video of my revised setup:

There are a few key differences between this setup and my previous one:

The main one is that the watering system has been 100% re-vamped. The water distribution happens via a hose with holes in it instead of using the tray at the bottom of the plant grid in the previous video.

It also takes, uploads and tweets a picture of itself using a raspberry pi camera module.

It also creates a new mysql table every two weeks, and in turn, renders a new kind of graph. The renderscript.php file receives an argument from the python script which is the table code.

Here’s the python script:

#Timing setup
from datetime import datetime
from apscheduler.scheduler import Scheduler
import time
import datetime
import sys
import os


now =datetime.datetime.now()


#import logging #if you start getting logging errors, uncomment these two lines
#logging.basicConfig()


#GPIO setup
import RPi.GPIO as GPIO
GPIO.setmode(GPIO.BOARD)
GPIO.cleanup()
pin = 26 #pin for the adc
GPIO.setup(pin, GPIO.OUT)
NPNtrans = 3 #the pin for the npn transistor
GPIO.setup(NPNtrans, GPIO.OUT)
sampleLED = 5 #the indicator LED
GPIO.setup(sampleLED, GPIO.OUT)
pump = 7 #pin for the pump
GPIO.setup(pump, GPIO.OUT)
GPIO.output(pump, False)


#the adc's SPI setup
import spidev
spi = spidev.SpiDev()
spi.open(0, 0)


#sets up the program's ability to write to a mysql database
import MySQLdb
con = MySQLdb.connect('localhost','piplanter_user','piplanter_pass','piplanter');
cursor = con.cursor()


#tweepy setup, you must use the keys given to you when you create your app
import tweepy
consumer_key=""
consumer_secret=""
access_token=""
access_token_secret=""
#"logs in" to twitter, 
auth = tweepy.OAuthHandler(consumer_key, consumer_secret)
auth.set_access_token(access_token, access_token_secret)
api = tweepy.API(auth)


#Flickr Setup
import flickrapi
api_key = ''
api_secret = ''
flickr = flickrapi.FlickrAPI(api_key, api_secret, format='json')
(token, frob) = flickr.get_token_part_one(perms='write')
if not token: raw_input("Press ENTER after you authorized this program")
flickr.get_token_part_two((token, frob))


#Variable Setup
ontime = 60


global table_number
table_number = 0


#fuction that can read the adc
def readadc(adcnum): 
# read SPI data from MCP3008 chip, 8 possible adc's (0 thru 7)
    if adcnum > 7 or adcnum < 0:
        return -1
    r = spi.xfer2([1, 8 + adcnum << 4, 0])
    adcout = ((r[1] & 3) << 8) + r[2]
    return adcout
     	
def water():
	
	print "===== Starting Watering Process ====="
	
	GPIO.output(NPNtrans, True)
	GPIO.output(sampleLED, True)
	
	time.sleep(1)
	
	sensor1_before = readadc(0)
	sensor2_before = readadc(1)
	sensor3_before = readadc(2)
	sensor4_before = readadc(3)
	
	before = "WATERING START / Moisture Before - " + "Sensor 1:" + str(sensor1_before) + " Sensor 2:" + str(sensor2_before) + " Sensor 3:" + str(sensor3_before) + " Sensor 4:" + str(sensor4_before) + " - Average:" + str((float(sensor1_before+sensor2_before+sensor3_before+sensor4_before)/4)) 
	api.update_status(before) 
	print before
	
	GPIO.output(pump, True)
	time.sleep(ontime)
	GPIO.output(pump, False)
	
	time.sleep(60) #gives the water time to penetrate the soil
	
	sensor1_after = readadc(0)
	sensor2_after = readadc(1)
	sensor3_after = readadc(2)
	sensor4_after = readadc(3)
	
	after = "WATERING COMPLETED / Moisture After - " + "Sensor 1:" + str(sensor1_after) + " Sensor 2:" + str(sensor2_after) + " Sensor 3:" + str(sensor3_after) + " Sensor 4:" + str(sensor4_after) + " - Average: " + str((float(sensor1_after+sensor2_after+sensor3_after+sensor4_after)/4)) 
	api.update_status(after) 
	print after
	
	GPIO.output(NPNtrans, False)
	GPIO.output(sampleLED, False)
	
	print "====== Watering Process Complete ====="    	
    	
def hourlyUpdate():
	GPIO.output(pump, False)
	print "----------start----------\n"
	
	GPIO.output(NPNtrans, True)
	GPIO.output(sampleLED, True)
	
	time.sleep(1)
	
	sampleTime = time.ctime()
	
	mst1 = 1024-readadc(0)
	mst2 = 1024-readadc(1)
	mst3 = 1024-readadc(2)
	mst4 = 1024-readadc(3)
	
	pot1 = readadc(4)
	
	ldr1 = readadc(5)
	
	millivolts = readadc(6)*(3300.0/1024.0)
	temp_c = ((millivolts - 100.0)/10)-40.0
	tmp1 = (temp_c * 9.0 / 5.0) + 32
	
	print 'Polling Probes \n'
	
	#prints debug info to console
	print sampleTime,"|","MST1:",mst1,"MST2:",mst2,"MST3:",mst3,"MST4:",mst4,"Pot1:",pot1,"LDR1:",ldr1,"TMP1:",tmp1 #prints the debug info
	
	global table_number
	print 'Adding Data To Table: ' + str(table_number)


	#adds the data to the mysql table
	global table_number
	cursor.execute('INSERT INTO piplanter_table_'+ table_code +'(Time,mst1_V,mst2_V,mst3_V,mst4_V,pot1_V,ldr1_V,tmp1_F) VALUES(%s,%s,%s,%s,%s,%s,%s,%s)',(sampleTime,mst1,mst2,mst3,mst4,pot1,ldr1,tmp1))
	con.commit() #this is important for live updating
	GPIO.output(NPNtrans, False) #turns the probes off
	print 'Data Collected, Disengaging Probes \n'
	
	
	#takes a picture of the plants
	print 'Taking Picture with Raspberry Pi Camera Board'
	picture_dir = '/home/pi/documents/piplanter/images/'
	os.system('raspistill -o ' + picture_dir + str(time.strftime('%m-%d-%y_%H-%M-%S')) + '.jpg')
	print 'Capture Successfull: ' + picture_dir + str(time.strftime('%m-%d-%y_%H-%M-%S')) + '.jpg'
		
	#finds the newest image in the directory
	print '\nUploading Picture To Flickr'
	picture_allfiles = sorted(os.listdir(picture_dir), key=lambda p: os.path.getctime(os.path.join(picture_dir, p)))
	picture_newest = picture_dir+picture_allfiles[-1]
	print 'File for upload: ' + picture_newest #prints location and file to console
	
	#uploads the picture of the plants to flickr
	picture_title = 'Picture @ ' + str(sampleTime)
	picture_response = flickr.upload(filename=picture_newest, title=picture_title, format='etree') #uploads the file to flickr
	picture_photoID = picture_response.find('photoid').text #gets the id of the photo for constructing a url
	print 'Picture Upload Successful, Photo ID: ' + picture_photoID + '\n' #more debug info
	
	time.sleep(10)
	
	#renders the image of the graph
	print "Graph Render Start"
	global table_code
	os.system('php /opt/bitnami/wordpress/piplanter/renderScript.php ' + table_code ) #renders the .png file
	print "Graph Render Complete \n"
	
	#finds the newest image in the directory
	print 'Uploading Graph To Flickr'
	graph_allfiles = sorted(os.listdir('/opt/bitnami/wordpress/piplanter/renders/'), key=lambda p: os.path.getctime(os.path.join('/opt/bitnami/wordpress/piplanter/renders/', p)))
	graph_newest = '/opt/bitnami/wordpress/piplanter/renders/'+graph_allfiles[-1]
	print 'File for upload: ' + graph_newest #prints location and file to console
	
	graph_title = 'Graph @ ' + str(sampleTime)
	graph_response = flickr.upload(filename=graph_newest, title=graph_title, format='etree') #uploads the file to flickr
	graph_photoID = graph_response.find('photoid').text #gets the id of the photo for constructing a url
	print 'Graph Upload Successful, Photo ID: ' + graph_photoID + '\n' #more debug info
	
	#tweets the images and data
	send = 'Brghtnss: ' + str(format((((float(ldr1)/1024)*100)),'.0f')) + '% / ' + 'Tmprtr: ' + str(format(tmp1,'.0f')) + ' Dg F' + ' / Avg Plnt Moisture: '+  str(format(float((float((mst1+mst2+mst3+mst4)/4)/1024)*100),'.0f')) + '%' + ' Graph: ' + 'http://www.flickr.com/photos/97350286@N08/'+ str(graph_photoID) + ' Pic: ' + 'http://www.flickr.com/photos/97350286@N08/' + str(picture_photoID) #builds the text of the tweet
	print "Tweeting:" , send  #for debug purposes
	api.update_status(send) #tweets the tweet
		
	time.sleep(.1)
	GPIO.output(sampleLED, False)
	
	print "\n-----------end-----------"
	
def table_update():
	
	global table_number
	table_number = table_number + 1
	
	global table_code
	table_code = str(time.strftime('%m_%d_%y_%H_%M_%S')) + '__' + str(table_number)
	print 'Creating Table: ' + table_code
	cursor.execute('USE piplanter')
	con.commit()
	cursor.execute('CREATE TABLE piplanter_table_'+ table_code +'(Sample_Number INT NOT NULL AUTO_INCREMENT PRIMARY KEY, Time VARCHAR(100), mst1_V VARCHAR(100), mst2_V VARCHAR(100), mst3_V VARCHAR(100), mst4_V VARCHAR(100), pot1_V VARCHAR(100), ldr1_V VARCHAR(100), tmp1_F VARCHAR(100) );')
	con.commit()


table_update()
hourlyUpdate()
	
scheduler = Scheduler(standalone=True)


scheduler.add_interval_job(hourlyUpdate, hours=1)
scheduler.add_interval_job(water, days=1)
scheduler.add_interval_job(table_update, weeks=2)


scheduler.start() #runs the program indefianately once every hour

Here’s the .php script:

<?php

/* Include all the classes */ 
include("/srv/www/lib/pChart/class/pData.class.php");
include("/srv/www/lib/pChart/class/pDraw.class.php");
include("/srv/www/lib/pChart/class/pImage.class.php");

$myData = new pData(); /* Create your dataset object */ 

$db = mysql_connect("localhost", "piplanter_user", "piplanter_pass"); //location of server, db username, db pass
mysql_select_db("piplanter", $db);

$Requete = "SELECT * FROM `piplanter_table_" . $argv[1] . "`"; //table name
$Result = mysql_query($Requete, $db);

/*This fetches the data from the mysql database, and adds it to pchart as points*/
while($row = mysql_fetch_array($Result))
{	
	$Time = $row["Time"];
	$myData->addPoints($Time,"Time");
	
	$mst1_V = $row["mst1_V"];
	$myData->addPoints($mst1_V,"mst1_V");
	$mst2_V = $row["mst2_V"];
	$myData->addPoints($mst2_V,"mst2_V");
	$mst3_V = $row["mst3_V"];
	$myData->addPoints($mst3_V,"mst3_V");
	$mst4_V = $row["mst4_V"];
	$myData->addPoints($mst4_V,"mst4_V");
	
	$ldr1_V = $row["ldr1_V"];
	$myData->addPoints($ldr1_V,"ldr1_V");
	
	$tmp1_F = $row["tmp1_F"];
	$myData->addPoints($tmp1_F,"tmp1_F");
}

$myData-> setSerieOnAxis("tmp1_F", 0); //assigns the data to the frist axis
$myData-> setAxisName(0, "Degrees F"); //adds the label to the first axis

$myData-> setSerieOnAxis("ldr1_V", 1);
$myData-> setAxisName(1, "LDR");

$myData-> setSerieOnAxis("mst1_V", 2);
$myData-> setSerieWeight("mst1_V",2);
$myData-> setSerieOnAxis("mst2_V", 2);
$myData-> setSerieOnAxis("mst3_V", 2);
$myData-> setSerieOnAxis("mst4_V", 2);
$myData-> setAxisName(2, "Relative Moisture");

$myData->setAbscissa("Time"); //sets the time data set as the x axis label

$myData-> setSerieWeight("mst1_V",1); //draws the line tickness
$myData->setPalette("mst1_V",array("R"=>58,"G"=>95,"B"=>205,"Alpha"=>80)); //sets the line color
$myData-> setSerieWeight("mst2_V",1);
$myData->setPalette("mst2_V",array("R"=>39,"G"=>64,"B"=>139,"Alpha"=>80));
$myData-> setSerieWeight("mst3_V",1);
$myData->setPalette("mst3_V",array("R"=>0,"G"=>34,"B"=>102,"Alpha"=>80));
$myData-> setSerieWeight("mst4_V",1);
$myData->setPalette("mst4_V",array("R"=>67,"G"=>110,"B"=>238,"Alpha"=>80));

$myData-> setSerieWeight("ldr1_V",2);
$myData-> setSerieTicks("ldr1_V", 4);

$myData-> setSerieWeight("tmp1_F",2);
$myData-> setSerieTicks("tmp1_F", 4);

$myPicture = new pImage(4000,500,$myData); /* Create a pChart object and associate your dataset */ 
$myPicture->setFontProperties(array("FontName"=>"/srv/www/lib/pChart/fonts/pf_arma_five.ttf","FontSize"=>6)); /* Choose a nice font */
$myPicture->setGraphArea(130,40,3900,300); /* Define the boundaries of the graph area */
$myPicture->drawScale(array("LabelRotation"=>320)); /* Draw the scale, keep everything automatic */ 

$Settings = array("R"=>250, "G"=>250, "B"=>250, "Dash"=>1, "DashR"=>0, "DashG"=>0, "DashB"=>0);

/*The combination makes a cool looking graph*/
$myPicture->drawPlotChart(array("DisplayValues"=>TRUE));
$myPicture->drawLineChart();
$myPicture->drawLegend(30,320); //adds the legend

//$date-> date("d-M-Y:H:i:s");

//$myPicture->autoOutput(); /* Build the PNG file and send it to the web browser */ 

$myPicture->render("/opt/bitnami/wordpress/piplanter/renders/".date("d-M-Y_H:i:s").".png");

?>

Thank you for reading!

PiPlanter – A Plant Growth Automator

New Version The Post Below Is Out Of Date Click Here For The New Version


This post is many months in the making and I am very proud of the thing’s I’ve done here, and very thankful to all of those (specifically at www.reddit.com/r/raspberry_pi) who have helped me along my way to getting this project up and running.

This page contains every single post related to this project, please feel free to go back and look at my progression and pick up tips along the way if you want to try something like this.

Let’s get this going, here’s an overview video:

There are 8 parts to this system and, you guessed it, I’ll be going in-depth about every single one!

Sensor Network

So at it’s core, the PiPlanter is a Sensor Network & Pump System. Here’s a video explaining the sensor array:

This project uses a TMP35-37 sensor to get a pretty precise temperature reading of the room. Later down in this post you can find out the algorithm to determine the temperature in Fahrenheit. It also uses a basic LDR to get the relative ambient light level in the room. Along with those two sensors, there are 4 relative humidity sensors of my own design, here’s a picture of them as seen in this post:

9allassemb

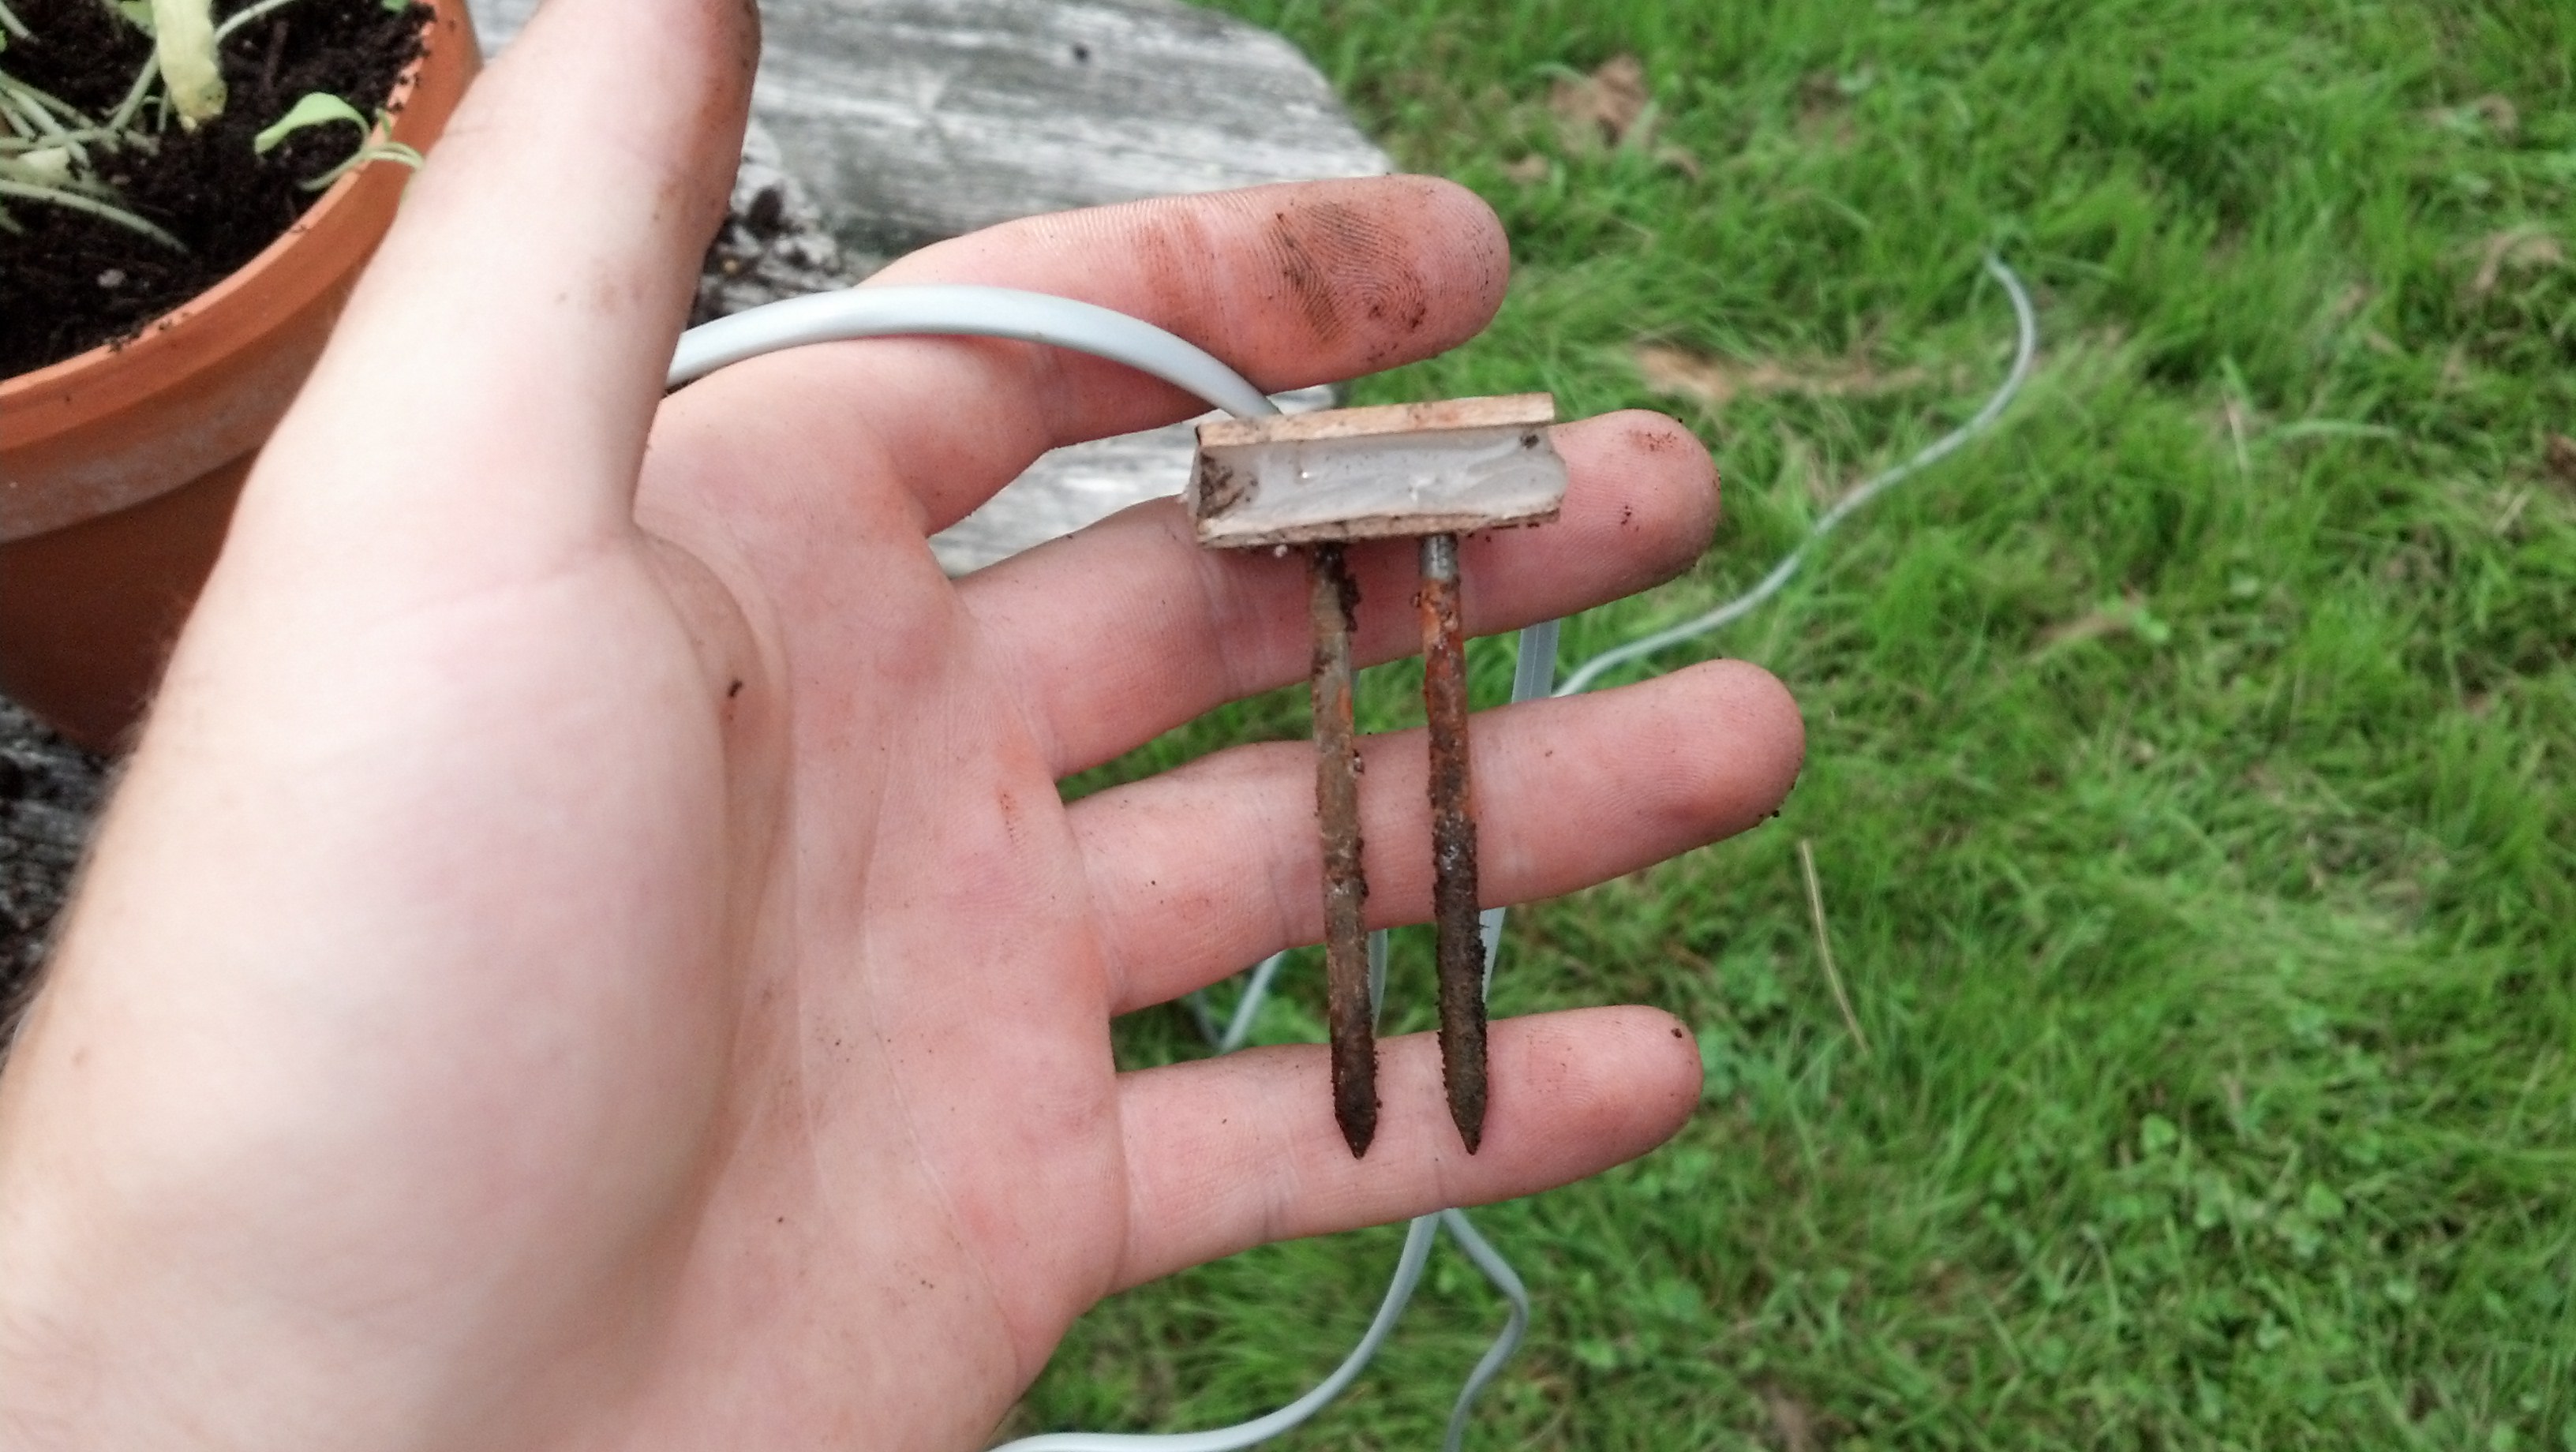
They’re hooked up to the ADC (mentioned later) in the same way that the LDR is, with a voltage dividing resistor, and then fed directly into ADC. The principal behind this sensor is that when you insert it into soil, the water in that soil connected the two probes, causing a voltage to flow across them. So if there is more water in the soil, more electrons will flow across them, and the analog value will be higher. It’s very basic, but it works. I’ve done several long term tests, and over time, as the soil becomes dryer, the value gets lower, indicating relative dryness. Here is a picture of the four probes in the soil, with the plants.

The TMP sensor’s output is plugged directly into the ADC and the LDR is very basically connected to the ADC as well, this is essentially how how the whole thing is setup on the breadboard:

Capture

Pump System

The pump system is pretty dead simple. Essentially it is a PowerSwitch Tail II switching the mains to a 9v DC power supply. The 9v power supply is connected directly to a 12v DC submersible pump. Instead of using a motor driver chip, which requires 3 pins to do, and the chip would get hot and whatnot, I’ve decided to go with this method.

The pump is not self priming. This means it cannot make the transition from pumping air to pumping water. I wrestled with this problem for a long time, and came up with what I think is an elegant solution. I submerged the pump directly into the water, which means the pump will never fill with air, and will always pump water when activated. Here’s a video explaining the pump system:

Raspberry Pi ADC

The next system is the ADC connected to the Raspberry Pi. It is an 8 bit, 8 port analog to digital converter that can easily run on 3.3v so it’s perfect for the pi. Here is the chip, and you set it up as follows (I took this from an earlier post I wrote)

Now we need to set up the specific libraries for python the first of which being spidev, the spi tool for the raspberry pi which we can grab from git using the following commands:

sudo apt-get install git
git clone git://github.com/doceme/py-spidev
cd py-spidev/
sudo apt-get install python-dev
sudo python setup.py install

You also need to (copied from http://scruss.com/blog/2013/01/19/the-quite-rubbish-clock/):

As root, edit the kernel module blacklist file:

sudo vi /etc/modprobe.d/raspi-blacklist.conf

Comment out the spi-bcm2708 line so it looks like this:

#blacklist spi-bcm2708

Save the file so that the module will load on future reboots. To enable the module now, enter:

sudo modprobe spi-bcm2708

To read from the ADC, add the following to your python code. The full code will be listed later:

#fuction that can read the adc
def readadc(adcnum):
# read SPI data from MCP3008 chip, 8 possible adc's (0 thru 7)
    if adcnum > 7 or adcnum < 0:
        return -1
    r = spi.xfer2([1, 8 + adcnum << 4, 0])
    adcout = ((r[1] & 3) << 8) + r[2]
    return adcout

So just use “readadc(n)” to get a value.

Python Code

I’ve made a real effort this time to comment my code well, so I’m not going to do a line by line breakdown like I often do, but I will clearly state the installs and setup things as follows. I’m assuming you have python-dev installed.

Download and install: APScheduler, this is a very straight forward install

Download and install: tweepy, you will need to go through the API setup process.

Download and install: flickrapi, you will need to go through the API setup process.

Here’s the source code for the python component of this project:

#Timing setup
from datetime import datetime
from apscheduler.scheduler import Scheduler
import time
import datetime
import sys
import os

now =datetime.datetime.now()

#import logging #if you start getting logging errors, uncomment these two lines
#logging.basicConfig()

#GPIO setup
import RPi.GPIO as GPIO
GPIO.setmode(GPIO.BOARD)
GPIO.cleanup()
pin = 26 #pin for the adc
GPIO.setup(pin, GPIO.OUT)
NPNtrans = 3 #the pin for the npn transistor
GPIO.setup(NPNtrans, GPIO.OUT)
sampleLED = 5 #the indicator LED
GPIO.setup(sampleLED, GPIO.OUT)
pump = 7 #pin for the pump
GPIO.setup(pump, GPIO.OUT)

#the adc's SPI setup
import spidev
spi = spidev.SpiDev()
spi.open(0, 0)

#sets up the program's ability to write to a mysql database
import MySQLdb
con = MySQLdb.connect('localhost','piplanter_user','piplanter_pass','piplanter');
cursor = con.cursor()

#tweepy setup, you must use the keys given to you when you create your app
import tweepy
consumer_key=""
consumer_secret=""
access_token=""
access_token_secret=""
#"logs in" to twitter,
auth = tweepy.OAuthHandler(consumer_key, consumer_secret)
auth.set_access_token(access_token, access_token_secret)
api = tweepy.API(auth)

#Flickr Setup
import flickrapi
api_key = ''
api_secret = ''
flickr = flickrapi.FlickrAPI(api_key, api_secret, format='json')
(token, frob) = flickr.get_token_part_one(perms='write')
if not token: raw_input("Press ENTER after you authorized this program")
flickr.get_token_part_two((token, frob))

#Variable Setup
ontime = 20

#fuction that can read the adc
def readadc(adcnum):
# read SPI data from MCP3008 chip, 8 possible adc's (0 thru 7)
    if adcnum > 7 or adcnum < 0:
        return -1
    r = spi.xfer2([1, 8 + adcnum << 4, 0])
    adcout = ((r[1] & 3) << 8) + r[2]
    return adcout

def slowSample():

	date0 = "21-06-2013 15"
	date1 = "25-06-2013 12"
	date2 = "29-06-2013 12"
	date3 = "04-07-2013 12"
	date4 = "06-07-2013 12"

	if str(time.strftime('%d-%m-%Y %H')) == date0:
		water()
	if str(time.strftime('%d-%m-%Y %H')) == date1:
		water()
	if str(time.strftime('%d-%m-%Y %H')) == date2:
		water()
	if str(time.strftime('%d-%m-%Y %H')) == date3:
		water()
	if str(time.strftime('%d-%m-%Y %H')) == date4:
		water()

	print "----------start----------"

	GPIO.output(NPNtrans, True)
	GPIO.output(sampleLED, True)

	time.sleep(1)

	sampleTime = time.ctime()

	mst1 = readadc(0)
	mst2 = readadc(1)
	mst3 = readadc(2)
	mst4 = readadc(3)

	pot1 = readadc(4)

	ldr1 = readadc(5)

	millivolts = readadc(6)*(3300.0/1024.0)
	temp_c = ((millivolts - 100.0)/10)-40.0
	tmp1 = (temp_c * 9.0 / 5.0) + 32

	#prints debug info to console
	print sampleTime,"|","MST1:",mst1,"MST2:",mst2,"MST3:",mst3,"MST4:",mst4,"Pot1:",pot1,"LDR1:",ldr1,"TMP1:",tmp1 #prints the debug info

	#adds the data to the mysql table
	cursor.execute("INSERT INTO piplanter_table_17(Time,mst1_V,mst2_V,mst3_V,mst4_V,pot1_V,ldr1_V,tmp1_F) VALUES(%s,%s,%s,%s,%s,%s,%s,%s)",(sampleTime,mst1,mst2,mst3,mst4,pot1,ldr1,tmp1))
	con.commit() #this is important for live updating

	GPIO.output(NPNtrans, False) #turns the probes off

	#renders the image of the graph
	print "render start"
	os.system("php /opt/bitnami/wordpress/piplanter/renderScript.php") #renders the .png file
	print "render complete"

	#finds the newest image in the directory
	allfiles = sorted(os.listdir('/opt/bitnami/wordpress/piplanter/renders/'), key=lambda p: os.path.getctime(os.path.join('/opt/bitnami/wordpress/piplanter/renders/', p)))
	newest = '/opt/bitnami/wordpress/piplanter/renders/'+allfiles[-1]
	print 'File for upload: ' + newest #prints location and file to console

	response = flickr.upload(filename=newest, title=sampleTime, format='etree') #uploads the file to flickr
	photoID = response.find('photoid').text #gets the id of the photo for constructing a url
	print 'Upload Successful, Photo ID: ' + photoID #more debug info

	#tweets the image and data
	send = 'Brghtnss: ' + str(format((((float(ldr1)/1024)*100)),'.0f')) + '% / ' + 'Tmprtr: ' + str(format(tmp1,'.0f')) + ' Dg F' + ' / Avg Plnt Moisture: '+  str(format(float((float((mst1+mst2+mst3+mst4)/4)/1024)*100),'.0f')) + '%' + ' Graph: ' +'http://www.flickr.com/photos/97350286@N08/'+photoID +' - www.esologic.com/?p=643'  #builds the text of the tweet
	print "Tweeting:" , send  #for debug purposes
	api.update_status(send) #tweets the tweet

	time.sleep(.1)
	GPIO.output(sampleLED, False)

	print "-----------end-----------"

def water():

	print "===== Starting Watering Process ====="

	GPIO.output(NPNtrans, True)
	GPIO.output(sampleLED, True)

	time.sleep(1)

	sensor1_before = readadc(0)
	sensor2_before = readadc(1)
	sensor3_before = readadc(2)
	sensor4_before = readadc(3)

	before = "WATERING START / Moisture Before - " + "Sensor 1:" + str(sensor1_before) + " Sensor 2:" + str(sensor2_before) + " Sensor 3:" + str(sensor3_before) + " Sensor 4:" + str(sensor4_before) + " - Average:" + str((float(sensor1_before+sensor2_before+sensor3_before+sensor4_before)/4))
	api.update_status(before)
	print before

	GPIO.output(pump, True)
	time.sleep(ontime)
	GPIO.output(pump, False)

	time.sleep(60) #gives the water time to penetrate the soil

	sensor1_after = readadc(0)
	sensor2_after = readadc(1)
	sensor3_after = readadc(2)
	sensor4_after = readadc(3)

	after = "WATERING COMPLETED / Moisture After - " + "Sensor 1:" + str(sensor1_after) + " Sensor 2:" + str(sensor2_after) + " Sensor 3:" + str(sensor3_after) + " Sensor 4:" + str(sensor4_after) + " - Average: " + str((float(sensor1_after+sensor2_after+sensor3_after+sensor4_after)/4))
	api.update_status(after)
	print after

	GPIO.output(NPNtrans, False)
	GPIO.output(sampleLED, False)

	print "====== Watering Process Complete ====="
#water()
slowSample() #runs the sample once before the interval starts, mostly a debug function

scheduler = Scheduler(standalone=True)
scheduler.add_interval_job(slowSample, hours=1)
scheduler.start() #runs the program indefianately once every hour

There you go! Essentially, every hour, the raspberry pi samples data from 4 humidity probes, an LDR and a tmp sensor. Once the sampling is complete, it dumps the data into a mysql database. From there the data is rendered into a graph using pChart in the form of a .png image. From there, that .png files is uploaded to flickr using this api. Once the file is uploaded, it returns it’s photo ID to the python script. From there, a tweet is built containing the brightness at the time of the tweet, the temperature at the time of the tweet, and the average moisture of the plants. It also uses the photo ID from flickr obtained earlier to build a URL leading to that image on flickr which it tweets as well. The final part of the tweet is a url that leads to this post! (taken from)

MySQL Database

The database is extremely simple, after installing MySQL set it up and create table that follows this syntax:

CREATE TABLE piplanter_table_17(Sample_Number INT NOT NULL AUTO_INCREMENT PRIMARY KEY, Time VARCHAR(100), mst1_V VARCHAR(100), mst2_V VARCHAR(100), mst3_V VARCHAR(100), mst4_V VARCHAR(100), pot1_V VARCHAR(100), ldr1_V VARCHAR(100), tmp1_F VARCHAR(100) );

Pretty basic stuff, the table is just where the python script dumps the data every hour.

PChart Graph

The software driving the graphing part of the project is a bit of php graphing software called pchart. It allows me to graph mysql values from a table in a variety of ways. It is very important, and the code for the php script is as follows:

<?php

/* Include all the classes */
include("/srv/www/lib/pChart/class/pData.class.php");
include("/srv/www/lib/pChart/class/pDraw.class.php");
include("/srv/www/lib/pChart/class/pImage.class.php");

$myData = new pData(); /* Create your dataset object */

$db = mysql_connect("localhost", "user", "pass"); //location of server, db username, db pass
mysql_select_db("piplanter", $db);

$Requete = "SELECT * FROM `piplanter_table_17`"; //table name
$Result = mysql_query($Requete, $db);

/*This fetches the data from the mysql database, and adds it to pchart as points*/
while($row = mysql_fetch_array($Result))
{
	$Time = $row["Time"];
	$myData->addPoints($Time,"Time");

	$mst1_V = $row["mst1_V"];
	$myData->addPoints($mst1_V,"mst1_V");
	$mst2_V = $row["mst2_V"];
	$myData->addPoints($mst2_V,"mst2_V");
	$mst3_V = $row["mst3_V"];
	$myData->addPoints($mst3_V,"mst3_V");
	$mst4_V = $row["mst4_V"];
	$myData->addPoints($mst4_V,"mst4_V");

	$ldr1_V = $row["ldr1_V"];
	$myData->addPoints($ldr1_V,"ldr1_V");

	$tmp1_F = $row["tmp1_F"];
	$myData->addPoints($tmp1_F,"tmp1_F");
}

$myData-> setSerieOnAxis("tmp1_F", 0); //assigns the data to the frist axis
$myData-> setAxisName(0, "Degrees F"); //adds the label to the first axis

$myData-> setSerieOnAxis("ldr1_V", 1);
$myData-> setAxisName(1, "LDR");

$myData-> setSerieOnAxis("mst1_V", 2);
$myData-> setSerieWeight("mst1_V",2);
$myData-> setSerieOnAxis("mst2_V", 2);
$myData-> setSerieOnAxis("mst3_V", 2);
$myData-> setSerieOnAxis("mst4_V", 2);
$myData-> setAxisName(2, "Relative Moisture");

$myData->setAbscissa("Time"); //sets the time data set as the x axis label

$myData-> setSerieWeight("mst1_V",1); //draws the line tickness
$myData->setPalette("mst1_V",array("R"=>58,"G"=>95,"B"=>205,"Alpha"=>80)); //sets the line color
$myData-> setSerieWeight("mst2_V",1);
$myData->setPalette("mst2_V",array("R"=>39,"G"=>64,"B"=>139,"Alpha"=>80));
$myData-> setSerieWeight("mst3_V",1);
$myData->setPalette("mst3_V",array("R"=>0,"G"=>34,"B"=>102,"Alpha"=>80));
$myData-> setSerieWeight("mst4_V",1);
$myData->setPalette("mst4_V",array("R"=>67,"G"=>110,"B"=>238,"Alpha"=>80));

$myData-> setSerieWeight("ldr1_V",2);
$myData-> setSerieTicks("ldr1_V", 4);

$myData-> setSerieWeight("tmp1_F",2);
$myData-> setSerieTicks("tmp1_F", 4);

$myPicture = new pImage(2000,500,$myData); /* Create a pChart object and associate your dataset */
$myPicture->setFontProperties(array("FontName"=>"/srv/www/lib/pChart/fonts/pf_arma_five.ttf","FontSize"=>6)); /* Choose a nice font */
$myPicture->setGraphArea(130,40,1900,300); /* Define the boundaries of the graph area */
$myPicture->drawScale(array("LabelRotation"=>320)); /* Draw the scale, keep everything automatic */

$Settings = array("R"=>250, "G"=>250, "B"=>250, "Dash"=>1, "DashR"=>0, "DashG"=>0, "DashB"=>0);

/*The combination makes a cool looking graph*/
$myPicture->drawPlotChart();
$myPicture->drawLineChart();
$myPicture->drawLegend(30,320); //adds the legend

//$date-> date("d-M-Y:H:i:s");

//$myPicture->autoOutput(); /* Build the PNG file and send it to the web browser */

$myPicture->render("/opt/bitnami/wordpress/piplanter/renders/".date("d-M-Y_H:i:s").".png");

?>

As you may be able to guess, upon the calling of this script, the program looks for a table called “piplanter_table_17” and does a bunch of stuff as commented to produce a graph. This is what a sample graph looks like:

Wed Jun 26 19:39:17 2013

This is data taken over 6 days, and it’s a lot to look at, but it’s good stuff.

Twitter & Flickr Integration

As you hopefully derived from the python code, this project uses Twitter to send data to me. Instead of using an email server or sending sms messages, I decided on twitter because of a few reasons. I use the service constantly, so I won’t ever miss a tweet. The API seemed really easy to use (and it was!) and allowed more than one person to acess the data at any one time. I decided to use flickr as my image hosting service for a lot of the same reasons, but the main one was their 1TB storage per person. You’ve already seen a sample flickr upload, so here’s a sample tweet:

That’s essentially it! Thank you for reading, and please ask questions.