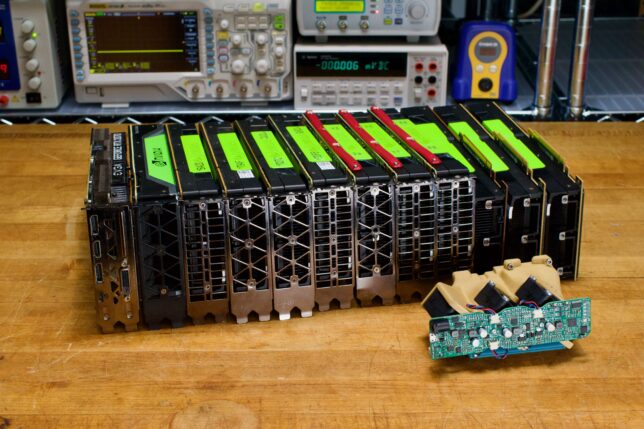
Decommissioned NVIDIA enterprise GPUs are one of the last remaining sources of idle VRAM. K80 with 24GB of GDDR5 sells for $60, P100-16GB for around $75 and V100-16GB for under $200. Shortcomings and all, it’s important to understand if we can utilize these widely available cards in the modern era. This project to benchmark tesla GPUs has been in the works for almost a year and over the winter I was able to spend many kilowatt hours heating up my studio with GPUs.
Box of Tesla GPUs
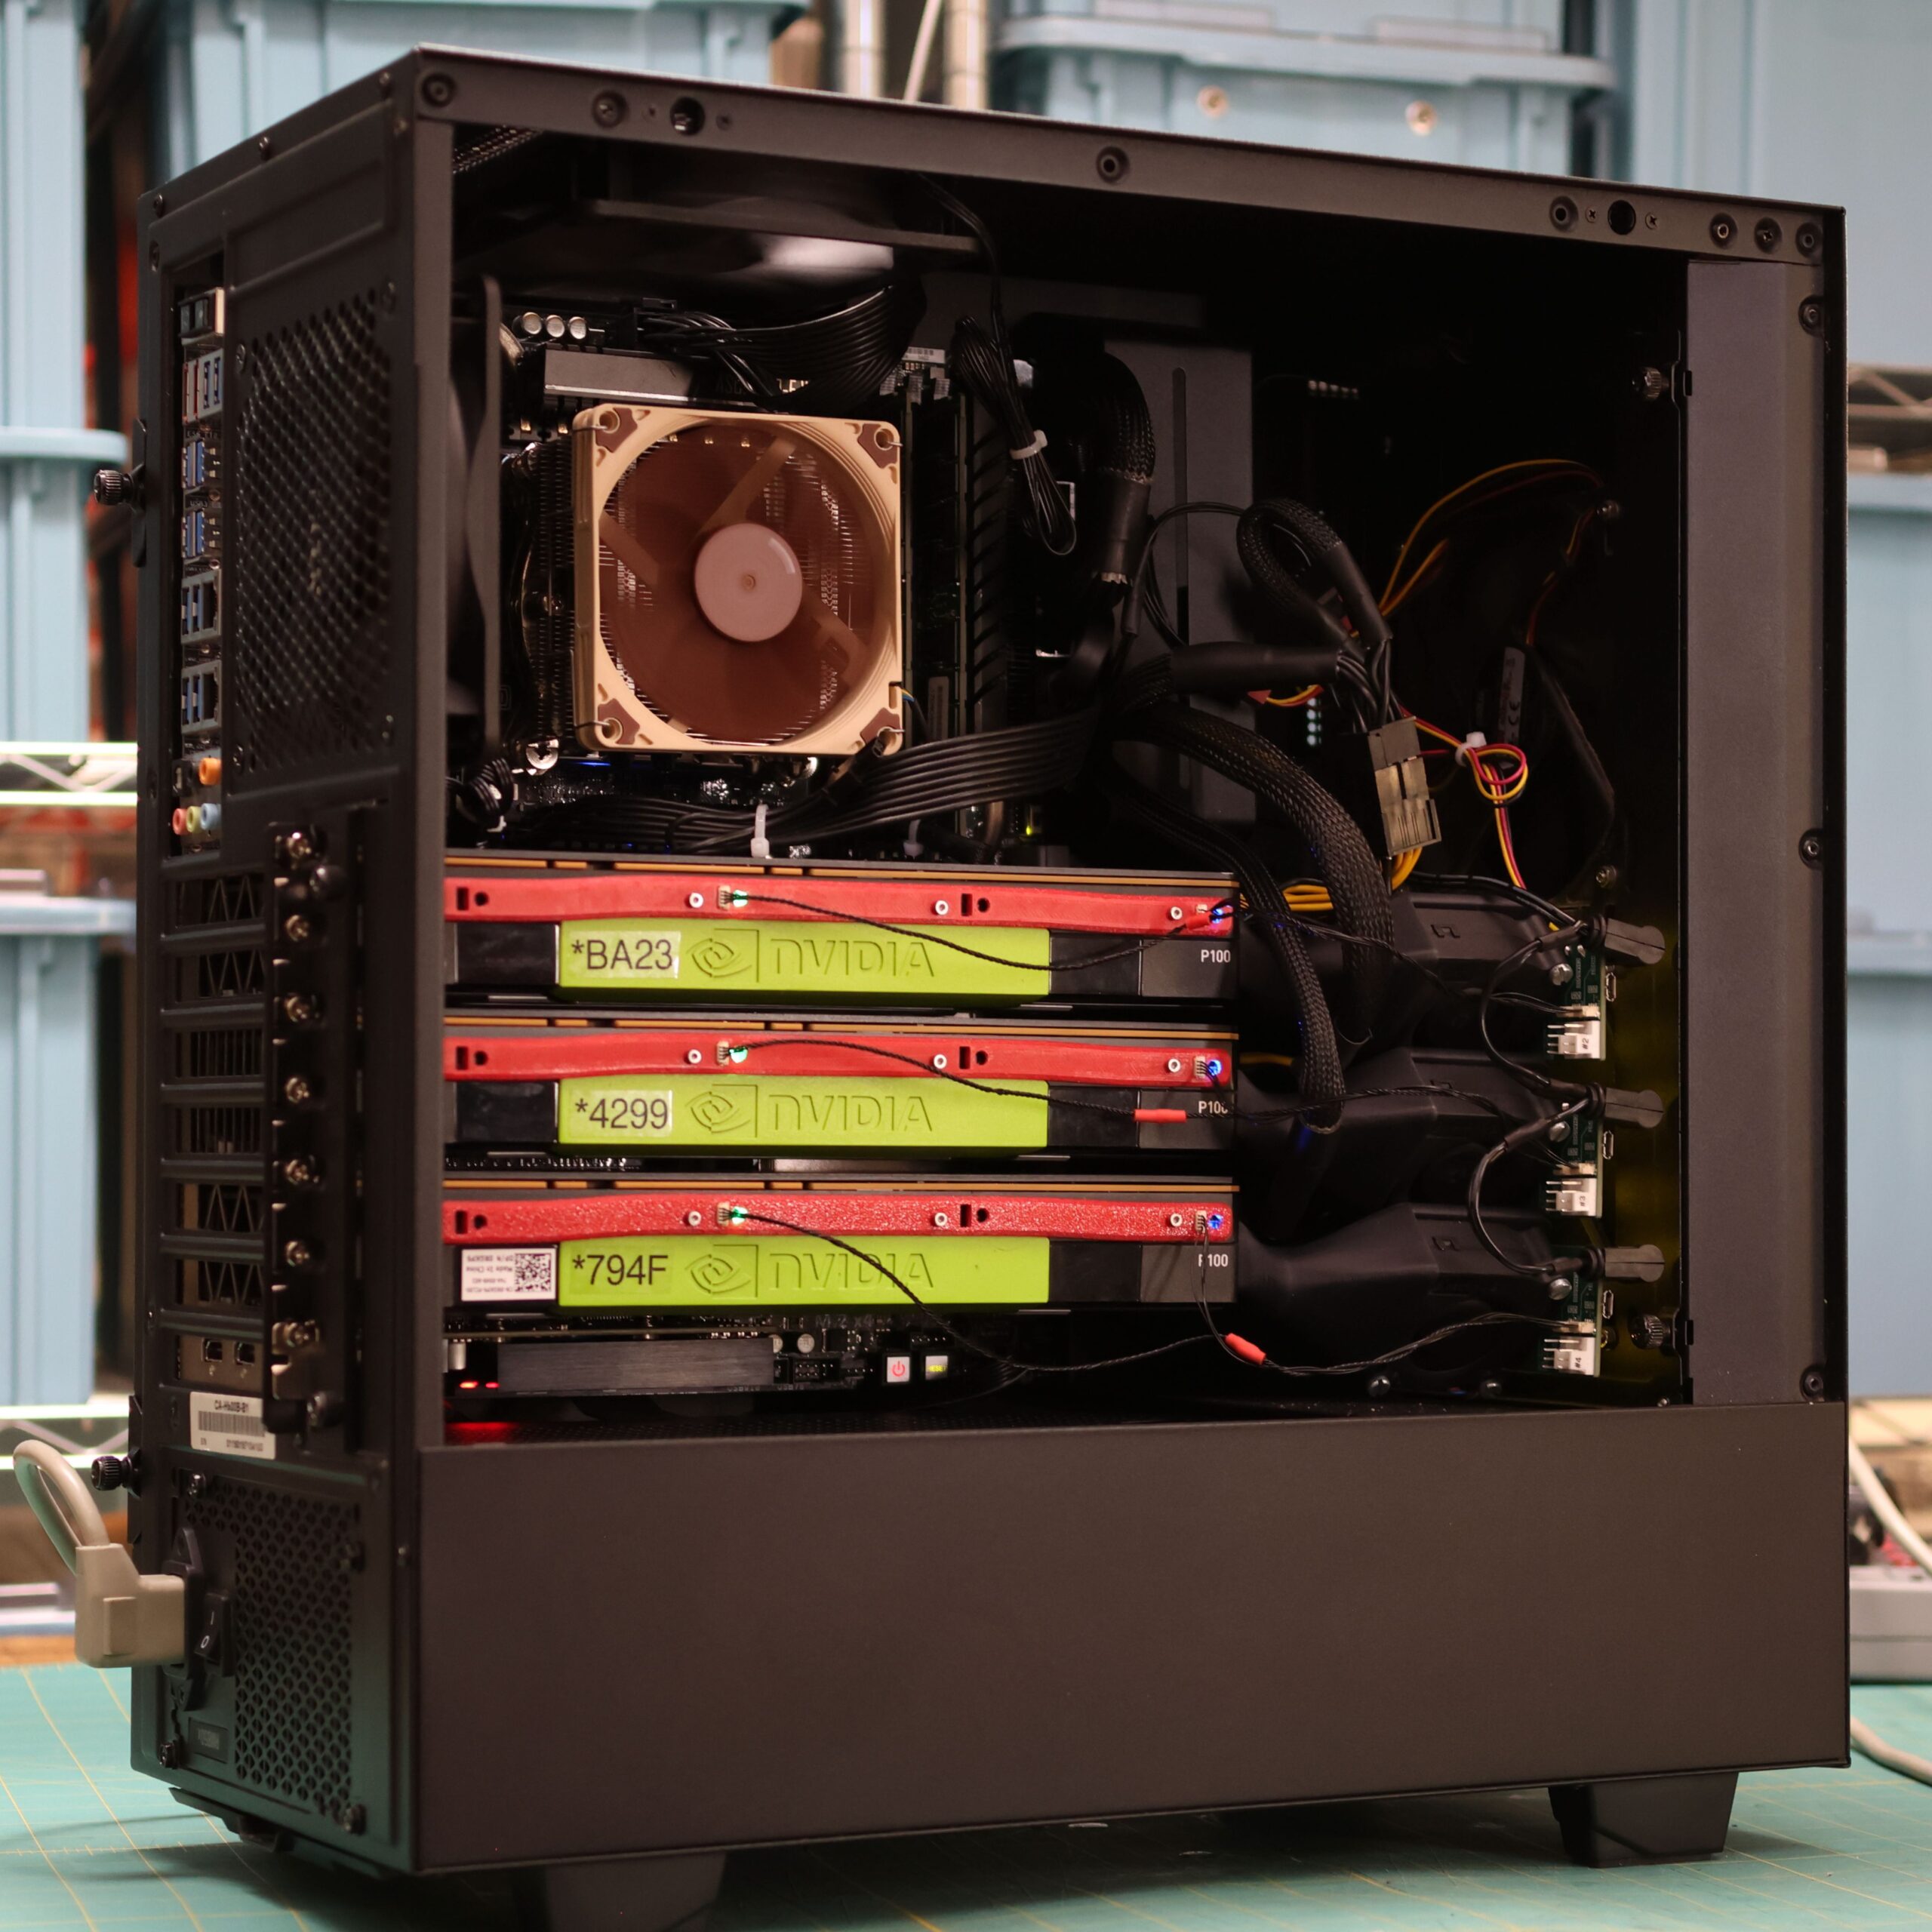
A goal of all this benchmarking is to come up with a BOM for an inexpensive, 4U GPU node for my homelab. With the right cooler (if you’d like a beta unit of the cooler, join the email list!), these cards are happy to be installed much more densely than their consumer-oriented counterparts. One can easily fit three GPUs and a 10GB NIC into a standard ATX case, rack mount or otherwise.
Similar to GPU price, the cost of X99 Intel E5-* Xeon CPUs and their associated hardware are now so cheap they can’t be ignored. $40 gets you 56 threads @ 3.50 GHz boost using E5-2690. The going rate is $200 for the massive Supermicro X10DRG-Q with its two CPU sockets and 7 PCIe slots. Choosing the CPU and motherboard for a GPU box is obviously important, but I wanted to have some hard numbers comparing the different schools of thought.
Don’t Be Afraid
Let’s note that all the hardware under examination here has been EOL’d. None of the GPUs are going to get CUDA compatibility updates or drivers anytime soon. Older gear is also going to be less power efficient, consuming much more energy per token. It is irresponsible to suggest these cards be used today.
… is the kind of finger wagging that has no place in homelabbing. The lack of software updates can be easily worked around by just using slightly older software. llama.cpp for example supports many CUDA architectures if you’re willing to build it from source. Using docker, I was able to get all of the software described below running on Kepler, an architecture released in 2014!
The power efficiency perspective is totally valid for high availability usecases. If you’re building something that is going to be used around the clock, you’ll quickly spend your savings on GPUs by paying for electricity. However this is also just not a usecase that is super relevant in the homelab. You’re not using LLMs or doing video processing? Turn off the box.
Content of the GPU Benchmarks
The benchmarking tool itself is published on github and I have already written a blog post about the development of the suite. Still though, here is a short description of the tests that appear in the resulting graphs.
| Benchmark | Category | AI | Description |
|---|---|---|---|
| ResNet50 Train B=64 | Computer Vision Training | ✅ | Measures GPU performance when training a convolutional neural network for image classification. |
| ResNet50 Infer B=1 | Computer Vision Inference | ✅ | Measures low-latency image classification inference on a single image. |
| ResNet50 Infer B=256 | Computer Vision Inference | ✅ | Measures high-throughput batched image classification inference. |
| Blender GPU | 3D Rendering | ❌ | Benchmarks production-style GPU path tracing for professional 3D rendering workloads. |
| Blender CPU | CPU Rendering | ❌ | Provides a CPU rendering baseline using the same Blender scene. |
| CAT ViT Scores | Vision Transformers | ✅ | Measures Vision Transformer inference throughput for image analysis and scoring. |
| CAT ViT Attention | Vision Transformers | ✅ | Measures Vision Transformer attention map generation, a more computationally intensive analysis workload. |
| llama.cpp Qwen2.5 1.5B Prompt | Large Language Models | ✅ | Measures prompt processing (prefill) performance for a small language model. |
| llama.cpp Qwen2.5 1.5B Gen | Large Language Models | ✅ | Measures autoregressive text generation throughput for a small language model. |
| llama.cpp Llama 3 8B Prompt | Large Language Models | ✅ | Measures prompt processing performance for a larger language model. |
| llama.cpp Llama 3 8B Gen | Large Language Models | ✅ | Measures autoregressive text generation throughput for a larger language model. |
| llama.cpp Qwen1.5 MoE Prompt | Large Language Models | ✅ | Measures prompt processing performance for a Mixture-of-Experts language model. |
| llama.cpp Qwen1.5 MoE Gen | Large Language Models | ✅ | Measures text generation throughput for a Mixture-of-Experts language model. |
| F@H Single | Scientific Computing | ❌ | Measures scientific compute performance using molecular dynamics simulations. |
| F@H Double | Scientific Computing | ❌ | Measures scientific compute performance under a heavier molecular dynamics workload. |
| SHA-256 | Cryptography | ❌ | Measures raw cryptographic hash computation throughput on the GPU. |
| Whisper Med FP16 | Speech Recognition | ✅ | Measures transformer-based speech-to-text inference performance. |
| Storage→CPU→GPU (gdsio) | AI Infrastructure | ✅ | Measures the throughput of loading data from storage into GPU memory, an important bottleneck for large AI models and datasets. |
Theory of Operation
The goal of the utility is to be able to benchmark Tesla GPUs, “GPU Box” style servers. The theory of operation for the benchmarking suite is as follows.
Benchmarks are defined as dockerfiles and run as docker containers for compatibility and portability. The containers are run first on each type of GPU attached to the system. For example if there is a K80, an M10 and a P100 in the system, the container is run first with one of the two cores on the K80, then on one out of the four cores on the M10, and then once on the P100 because it only has one logical core. Then the container is re-run on all attached cores of all attached GPUs in parallel. Finally, if the test is multi-GPU native, a container is created with access to all cores of all GPUs and the test is run. This is an example result for a system with 3 P100’s running a ResNet50 training test:
|
1 2 3 4 5 6 7 8 9 10 11 12 13 14 15 16 17 18 19 20 |
{ "name": "resnet50_train_batch_64", "benchmark_version": "0.2.0", "override_parameters": {}, "larger_better": true, "multi_gpu_native": true, "verbose_unit": "Images Processed / Second", "unit": "i/s", "critical_result_key": "native_multi_gpu_result", "numerical_results": { "min_by_gpu_type": 208.20215154739634, "max_by_gpu_type": 208.20215154739634, "mean_by_gpu_type": 208.20215154739634, "theoretical_multi_gpu_mean": 208.2021515473963, "theoretical_multi_gpu_sum": 624.606454642189, "forced_multi_gpu_numerical_mean": 205.4402100738262, "forced_multi_gpu_sum": 616.3206302214786, "native_multi_gpu_result": 566.5793352441259 } } |
The theoretical_multi_gpu_sum value is numerically calculated by taking the per GPU score summed over all the GPUs attached to the system. In our example, if the single K80 core scored 10, this value would be counted twice in theoretical_multi_gpu_sum. If the single M10 core scored 5, this value would be counted four times in theoretical_multi_gpu_sum. The next calculated value theoretical_multi_gpu_mean is computed by theoretical_multi_gpu_sum and dividing it by the number of GPUs attached to the system. The result forced_multi_gpu_sum is calculated by taking the sum of the results from the parallel run. Similar to the other mean value, forced_multi_gpu_numerical_mean is created by dividing forced_multi_gpu_sum by the number of GPUs. All of these different figures eventually be used to identify performance bottlenecks in GPU boxes or the tests themselves.
Currently, only the keys defined with critical_result_key are used in the visualizations. As of writing, these are all either native_multi_gpu_result or forced_multi_gpu_sum. Subplots titles marked with an asterisk are forced_multi_gpu_sum.
Hardware Under Test (Benchmarked Tesla GPUs)
GPUs: K80, M10, M40, M60, P40, P100, V100, T40
CPUs: E5-2687W 12-Core, E5-1680 8-Core
Motherboards: Asus X99-WS single socket, Supermicro X10DRG-Q dual socket
Results
Unless otherwise specified CPU and motherboard are the same within a set of results. The same RAM, chassis and power supply was used in every test. All GPUs were cooled with my cooler set to auto.
GPU Generation Comparison
For this first set of tests, we’ll be looking at results grouped by general usecase area across GPU generations. The expectation here is that in general performance should increase with release date, and the resulting bars left to right are ordered by the corresponding card’s release date.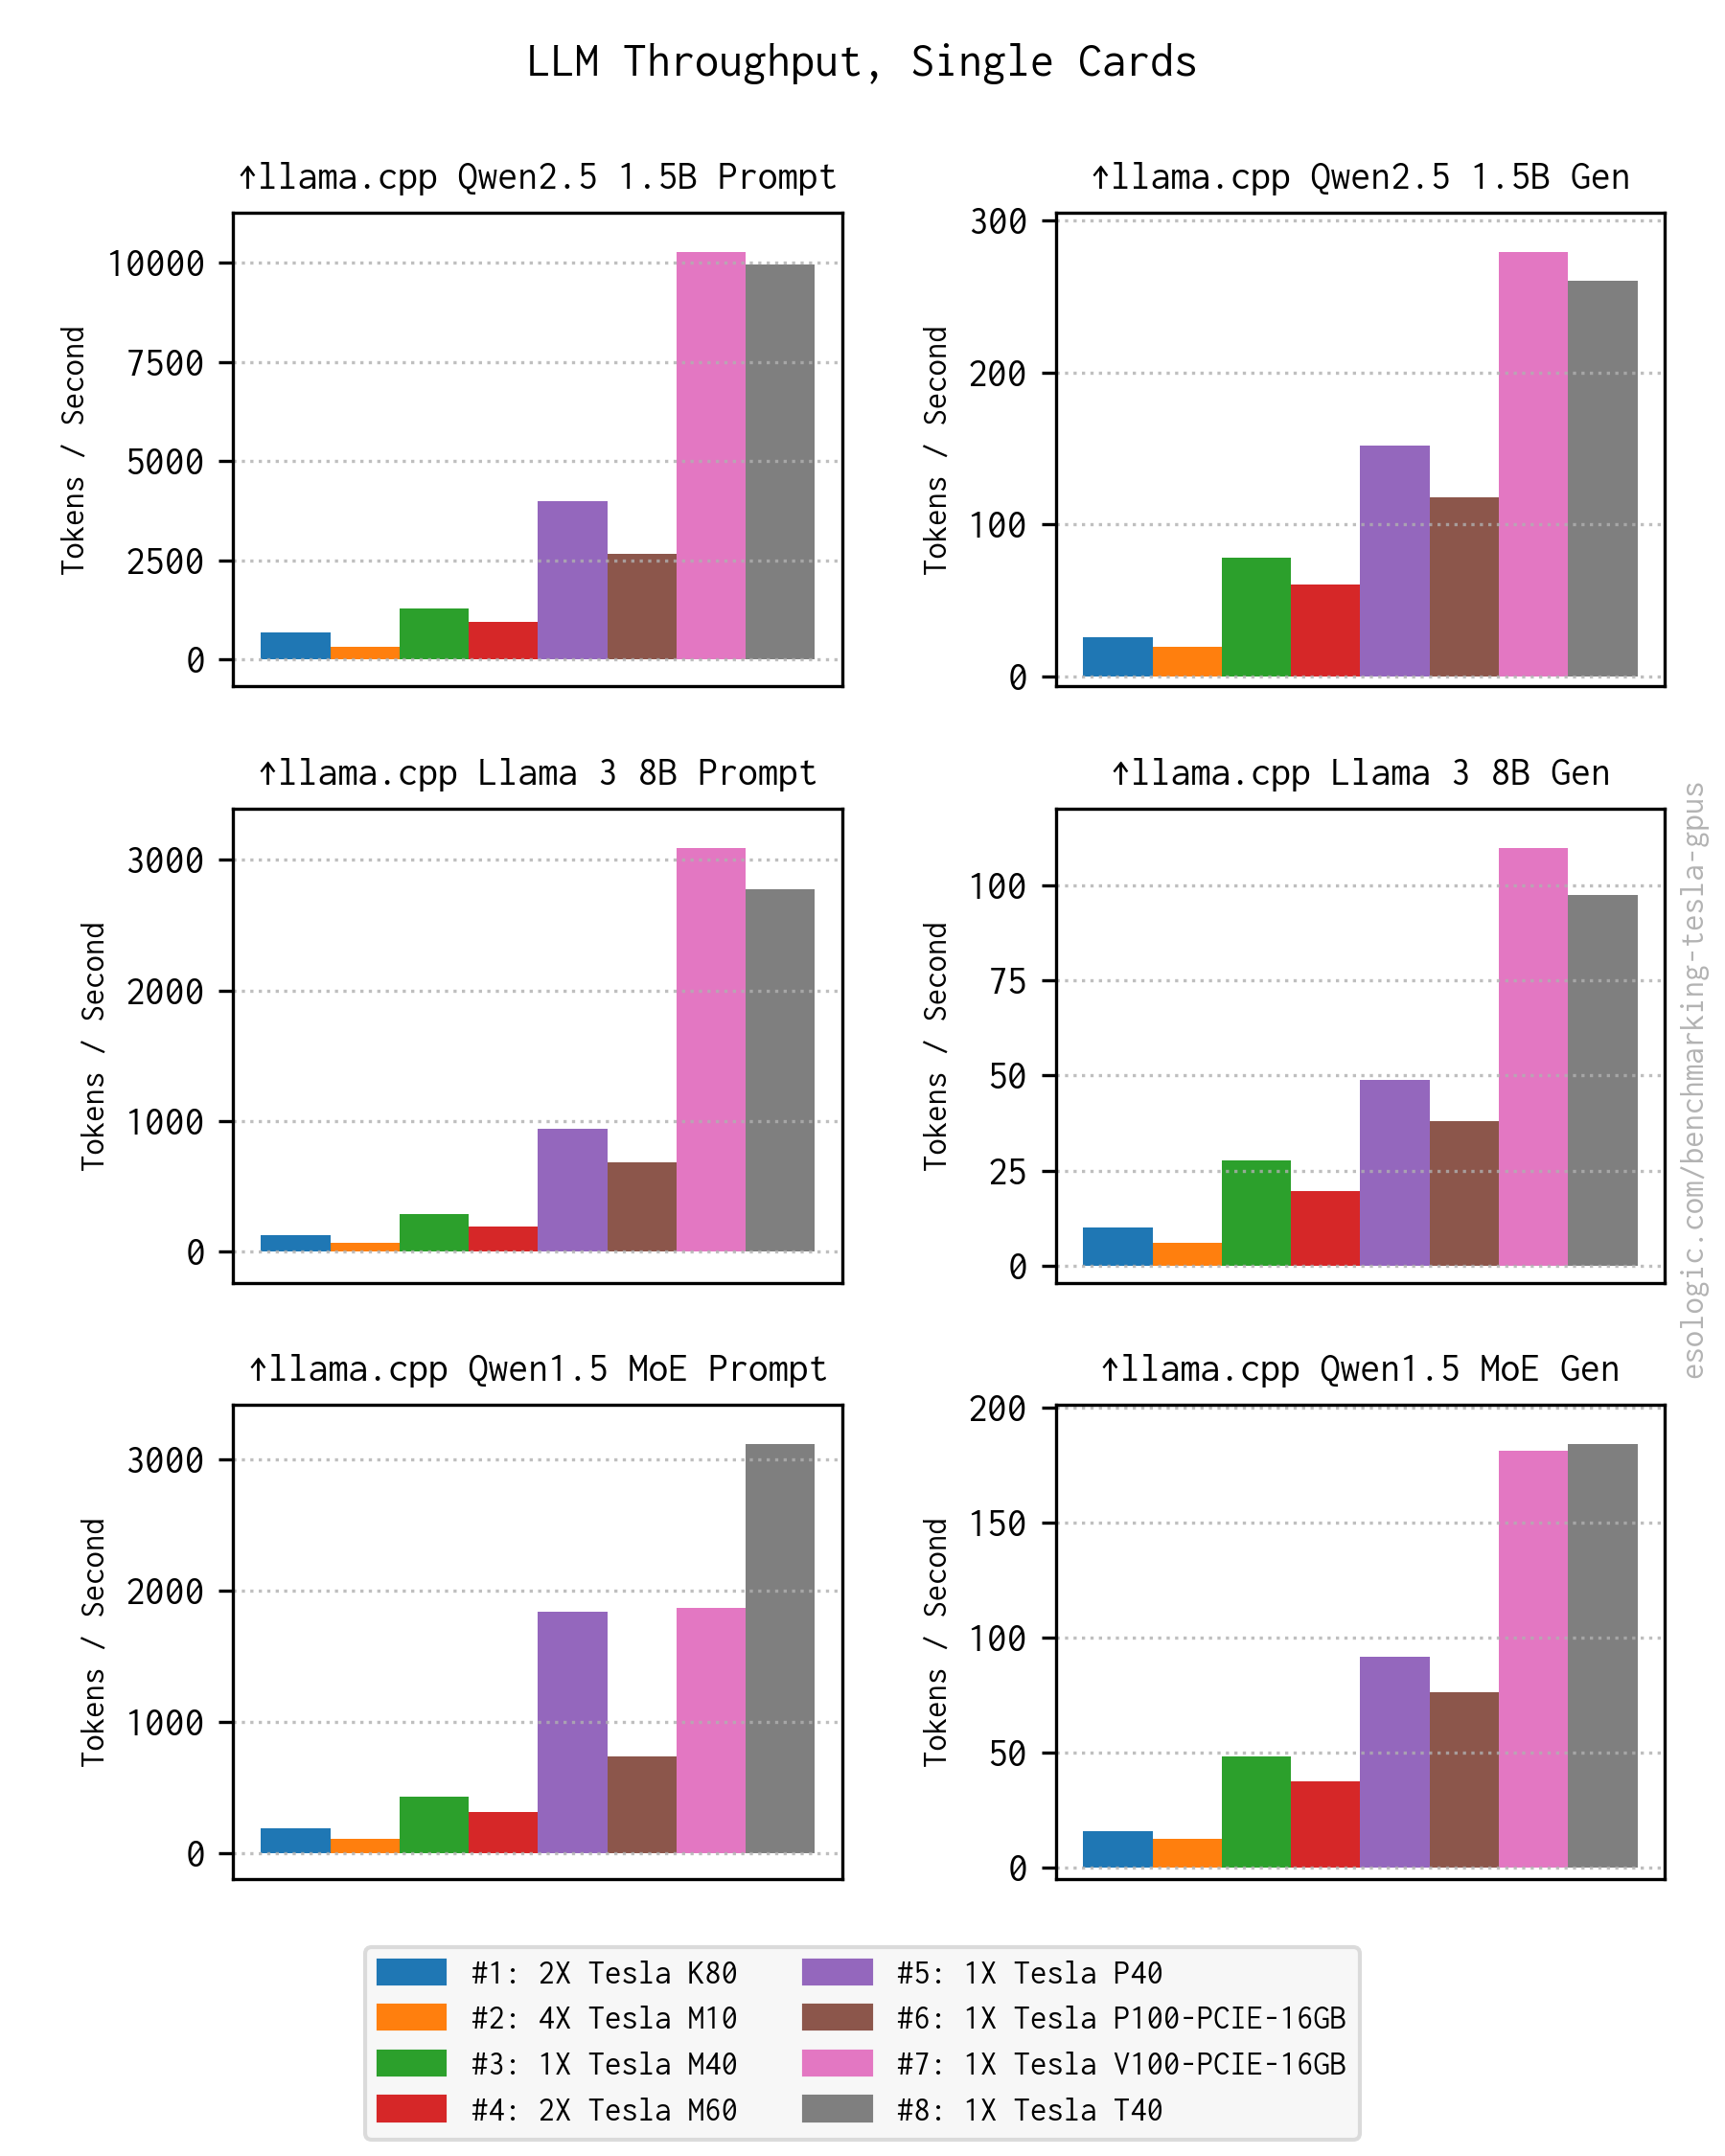
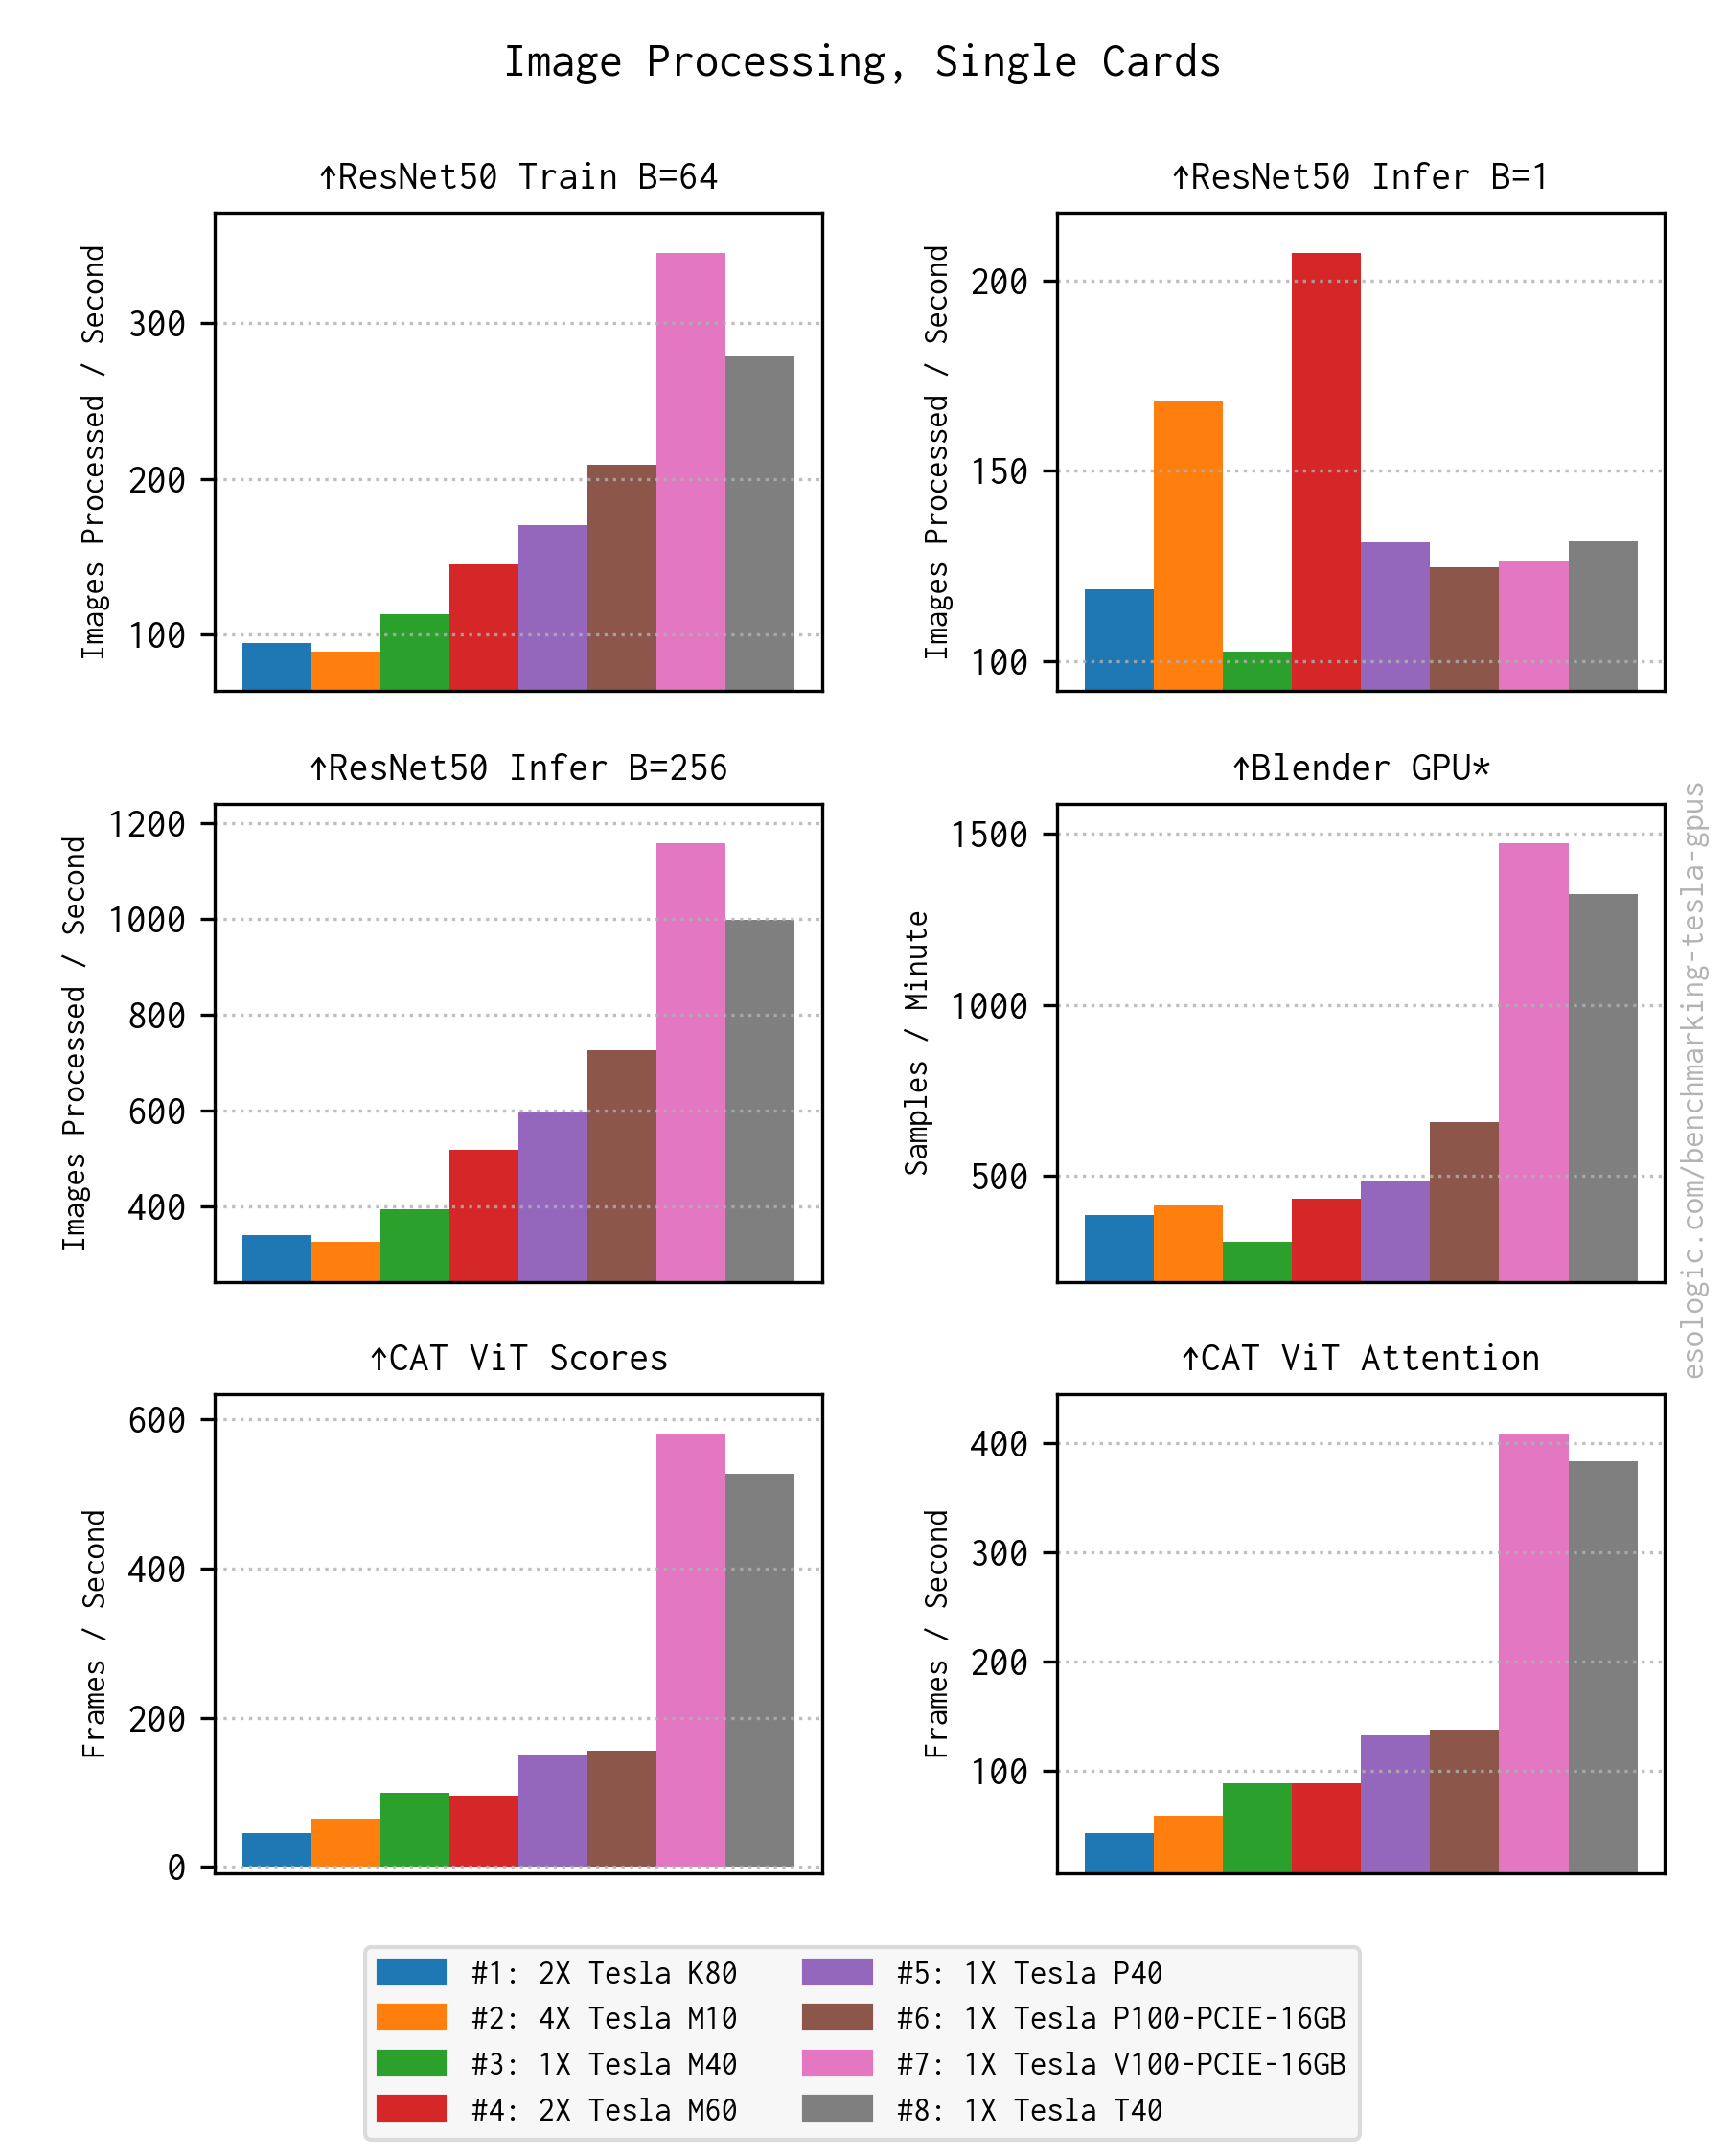
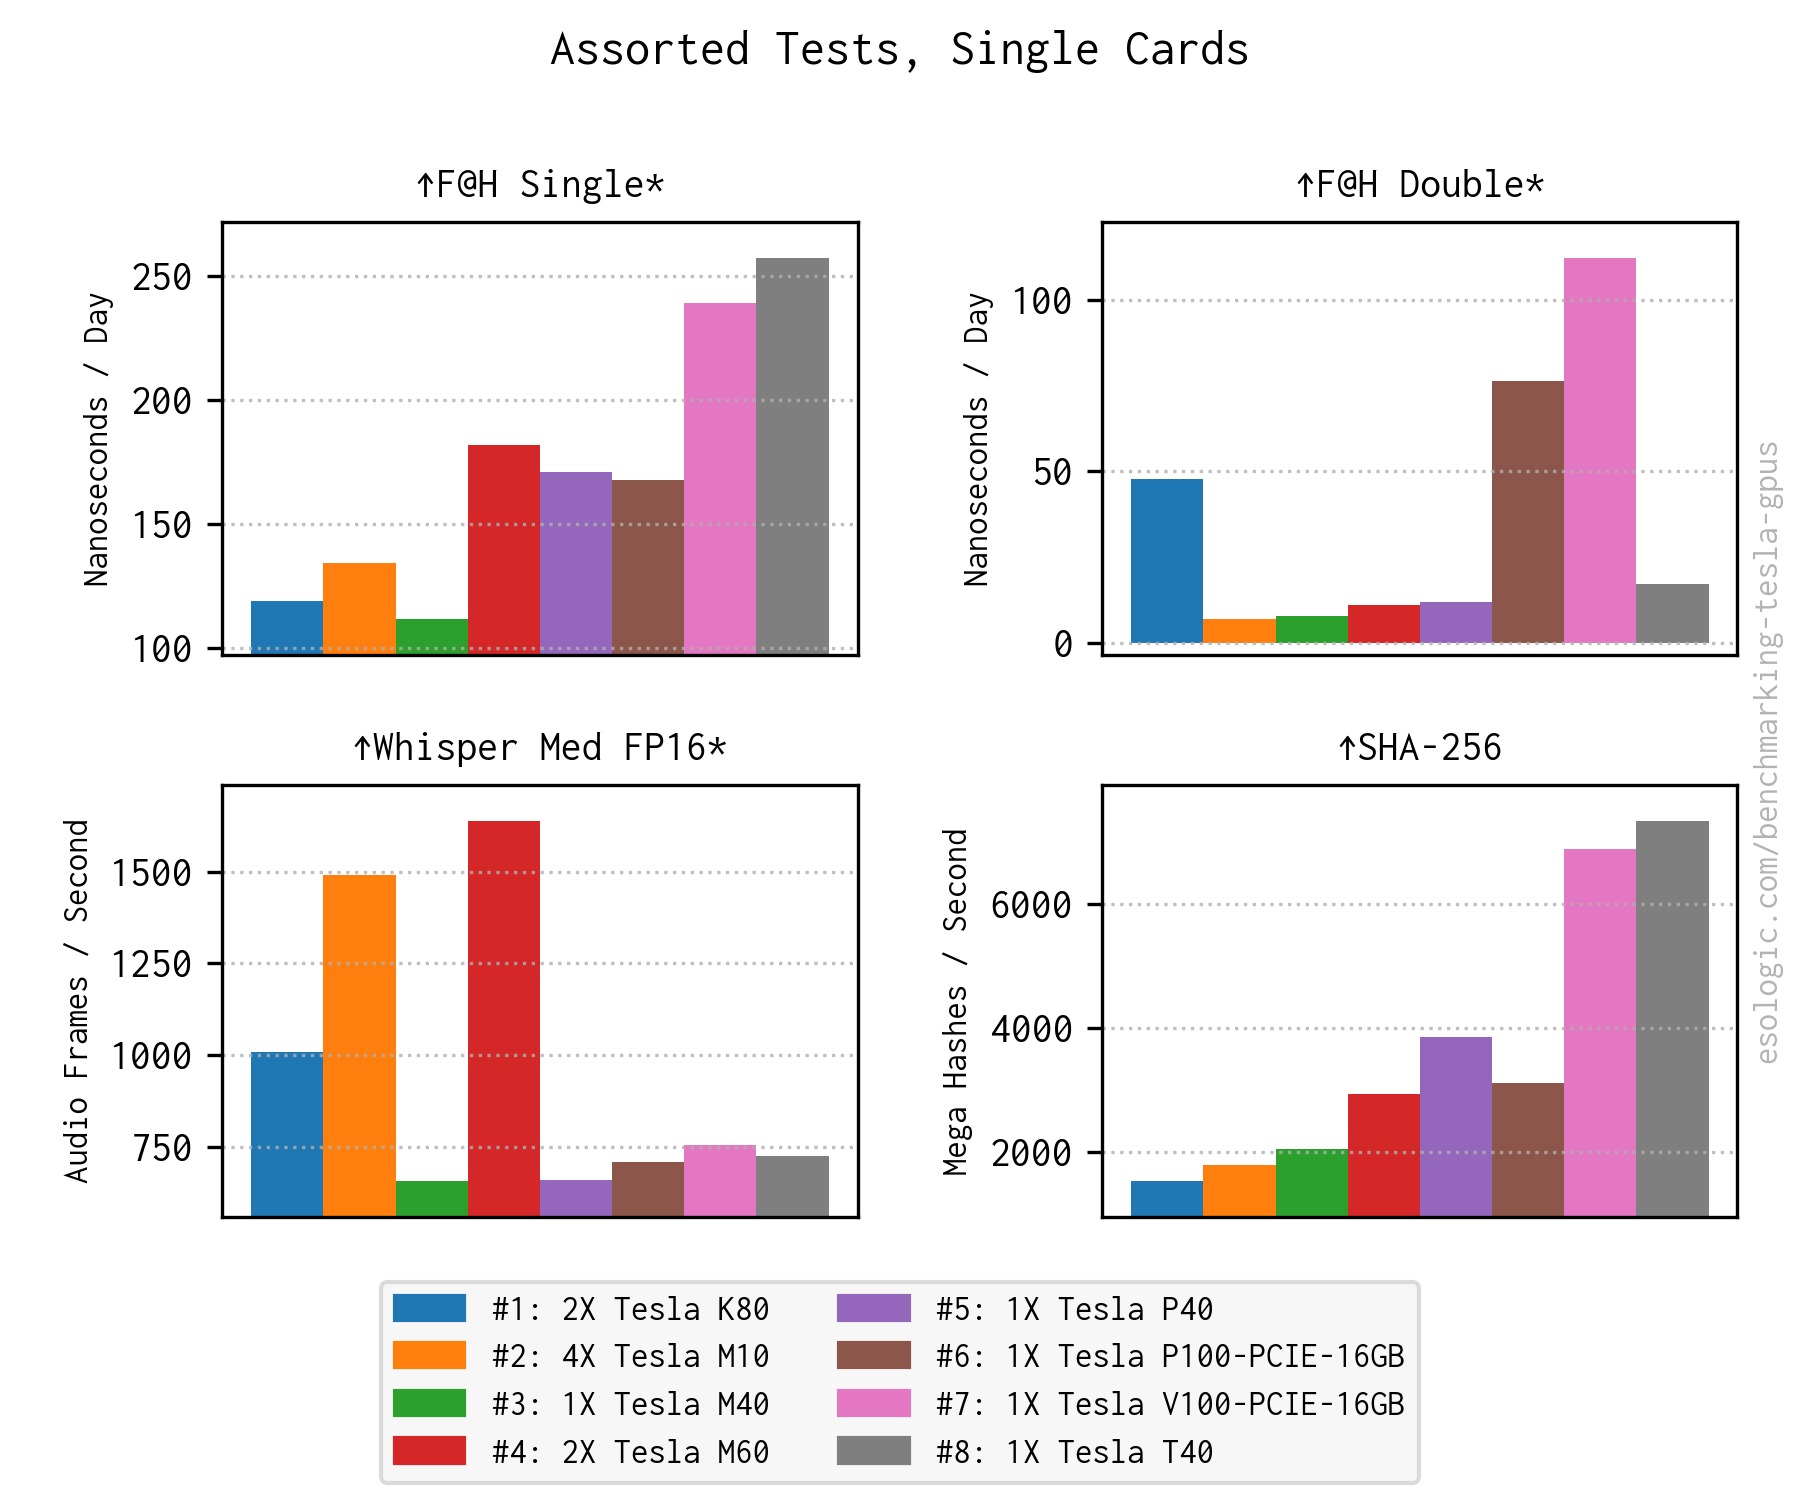
There are a few surprises right off the bat here. The overall performance of Tesla V100-16GB is right up there with (the somewhat rare) T40 in all tests. V100 is significantly older and less expensive than T40. Generally too, there is a major increase in performance with Volta over the previous incremental gains achieved in previous generations.
If you read for any amount of time online, you’ll find people recommending P40 over P100 for LLM usage and these results hold that finding as well.
I was very impressed by M60’s Whisper performance. If you have a ton of audio transcription to do, M60 can be had for only $50.
GPU Scaling
This next set of tests examines how performance changes as more cards are added to the system. The expectation here is that generally test performance should increase with the number of cards added to the system but with diminishing returns as more communication overhead is added.
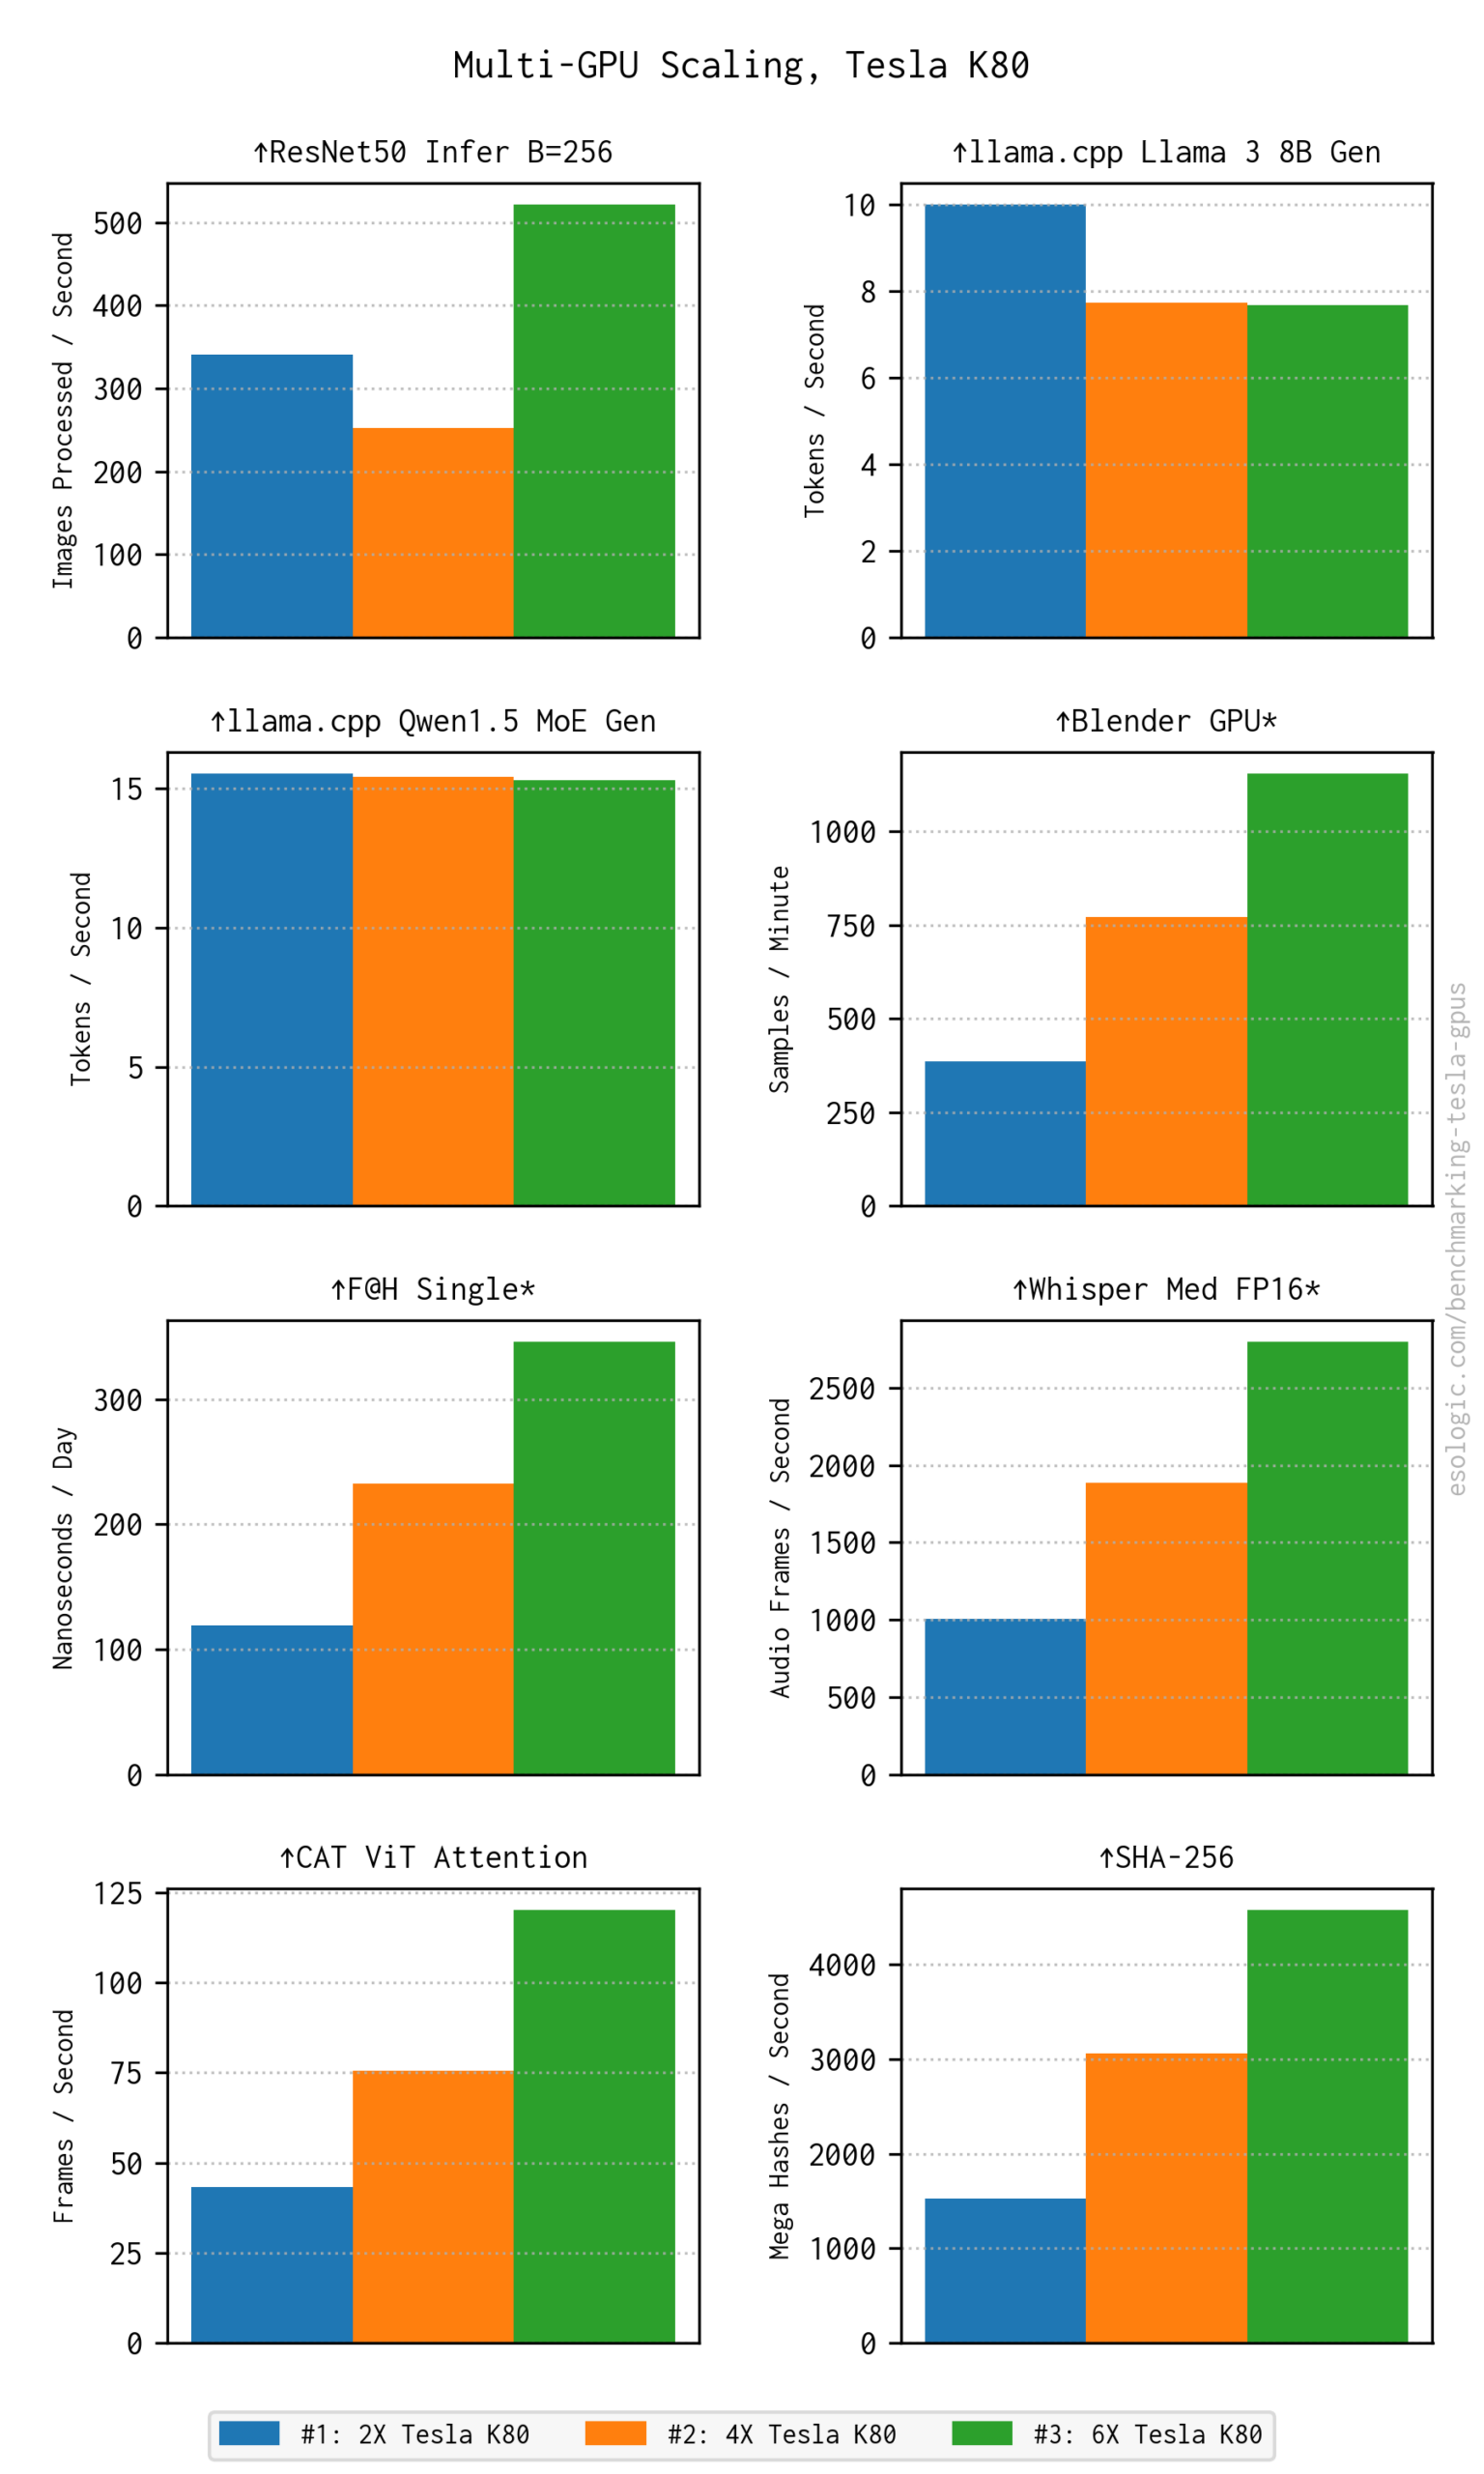
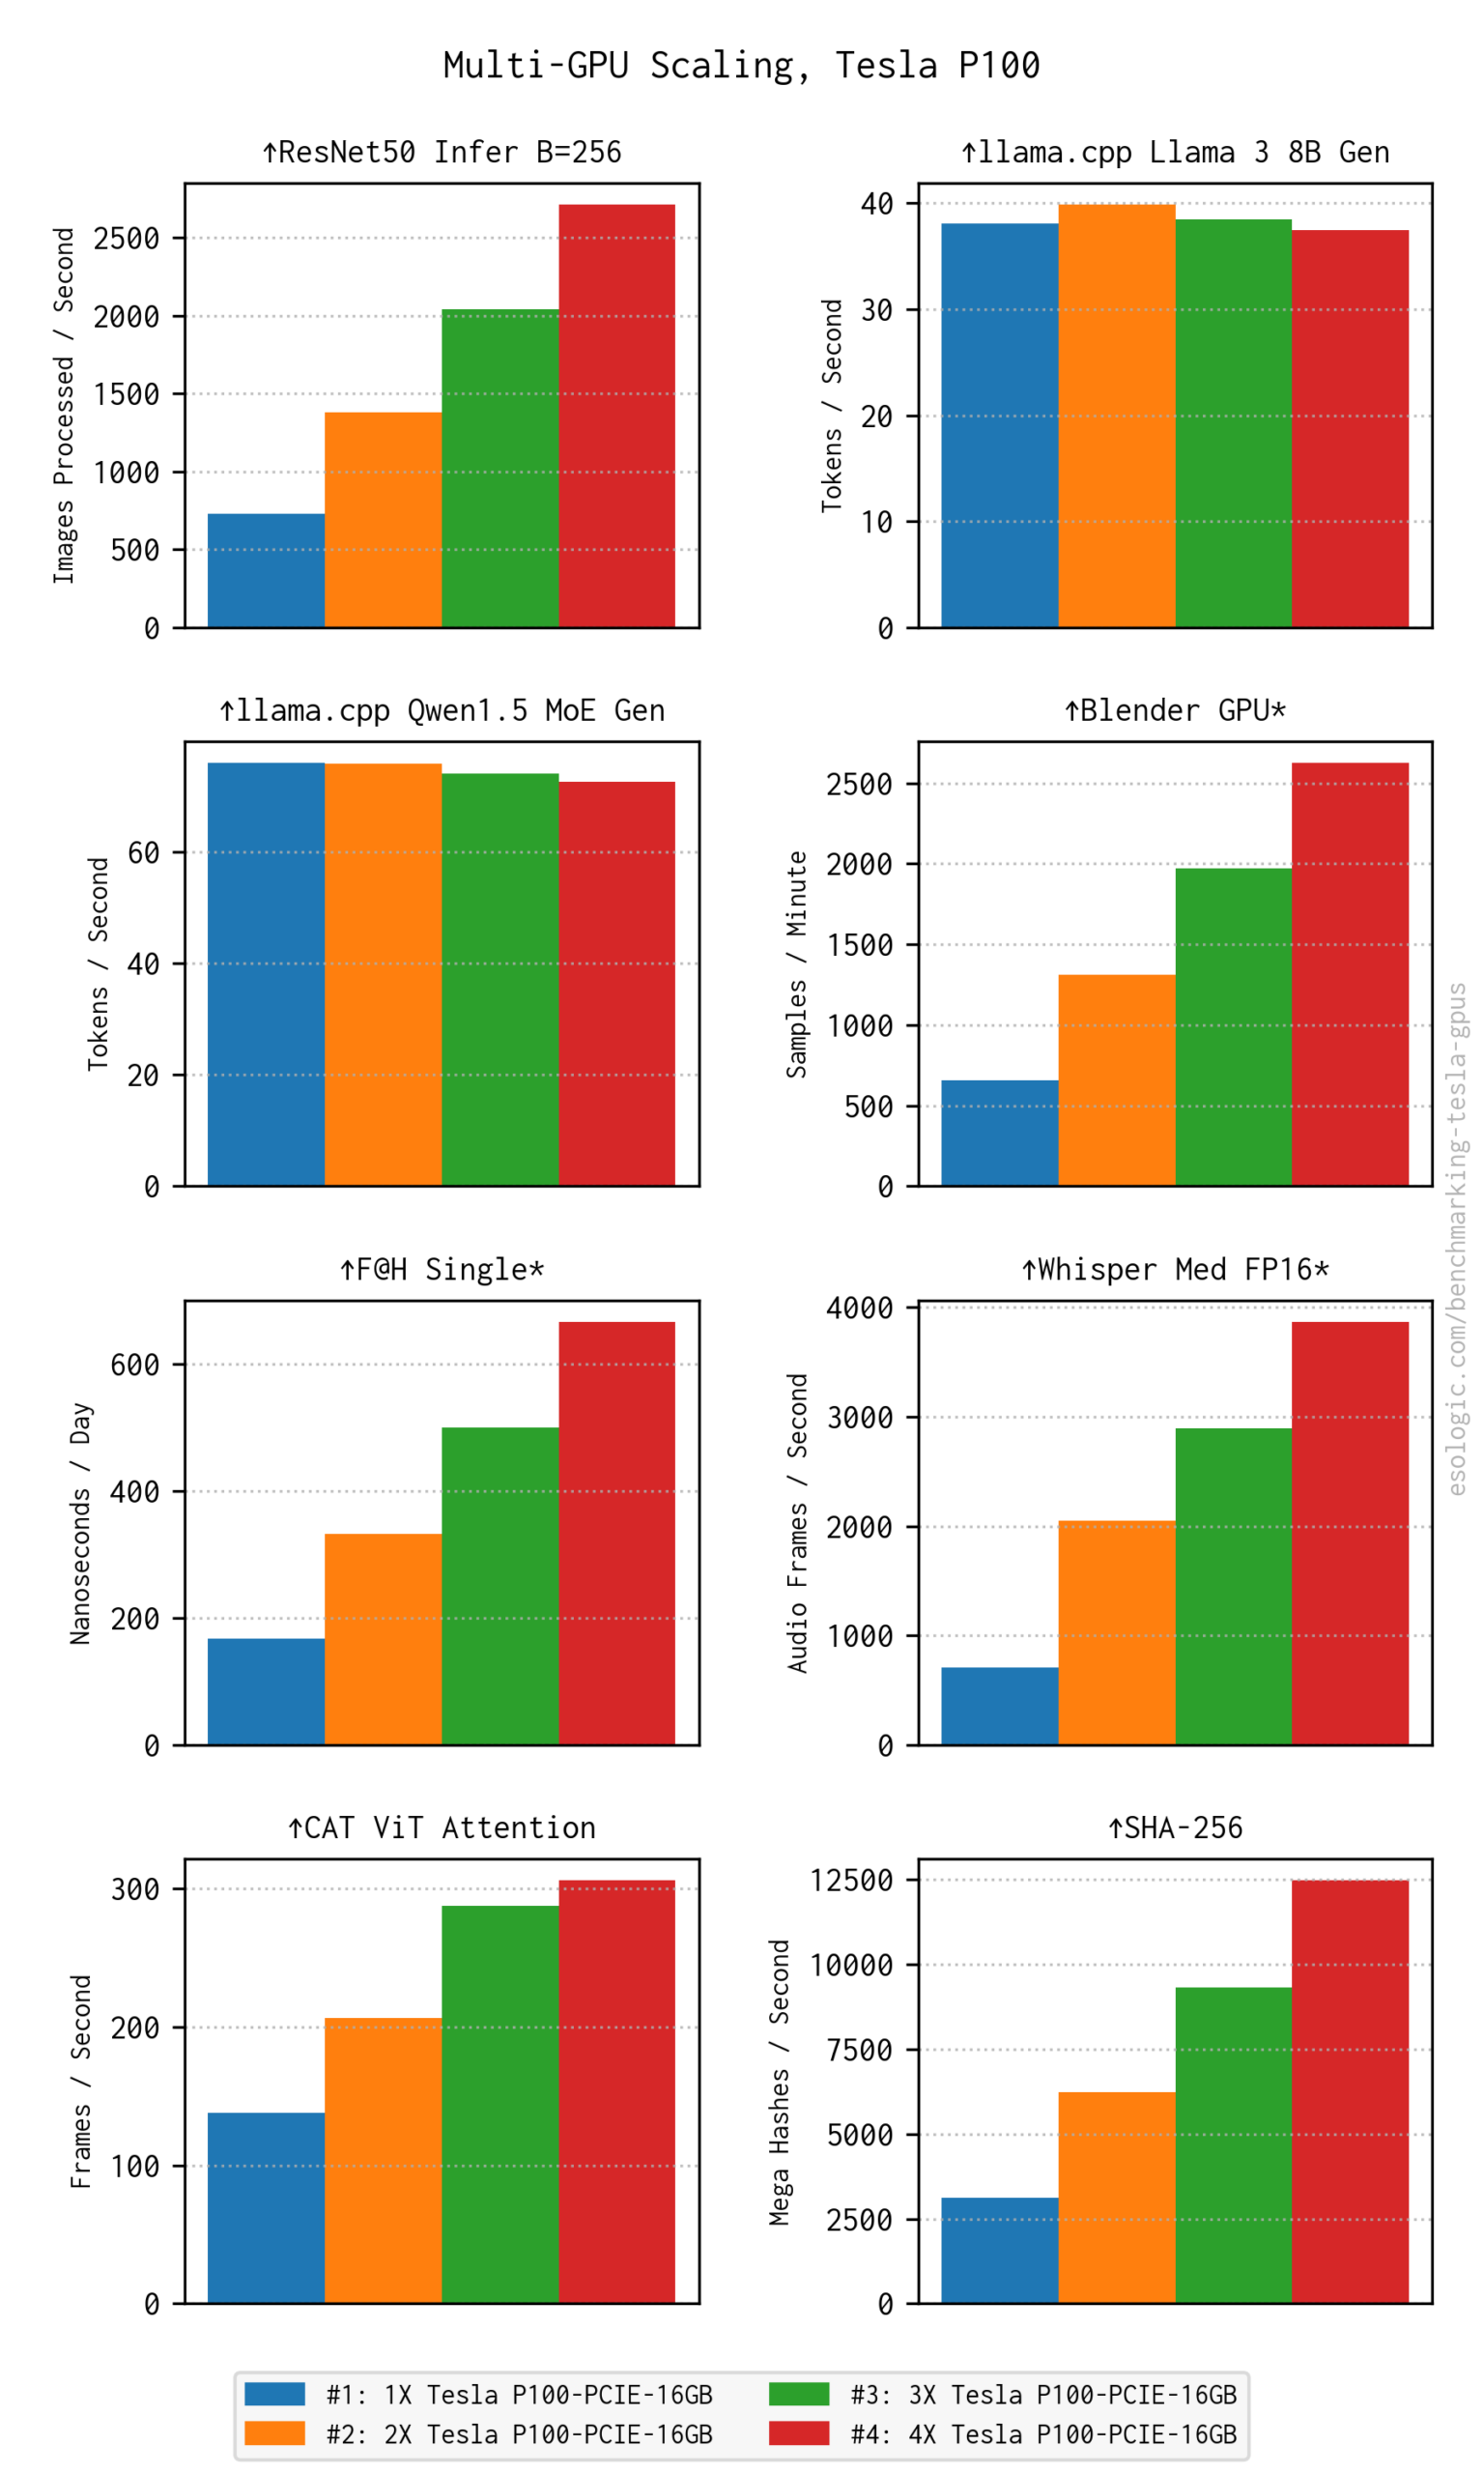
Interestingly, we see that LLM throughput stays the same as more GPUs are added. This points to a llama.cpp configuration issue on my part. PRs always appreciated if you know what is going on here.
For both K80 and P100, I’m really not seeing a ton of evidence of those diminishing returns except for CAT ViT Attention on P100. Other, more mature multi-GPU native tests (ResNet50 and SHA-256) increase linearly with the GPU count. I’ll speculate: maybe there would have to be diminishing returns eventually, but the horizon is probably further away than you could fit in 4U.
This is a great news for the homelabber looking to add a dedicated GPU node and a welcome outcome of this effort to benchmark tesla GPUs. In this scenario the rack units are already occupied and you want them to be as productive as possible. It does not look like filling a chassis with GPUs would lead to a lot of wasted compute due to overhead.
GPU Mixing
More of a what-if than an actual question, but I was curious what the results would be if a newer more expensive GPU was combined with a bunch of inexpensive older GPUs.
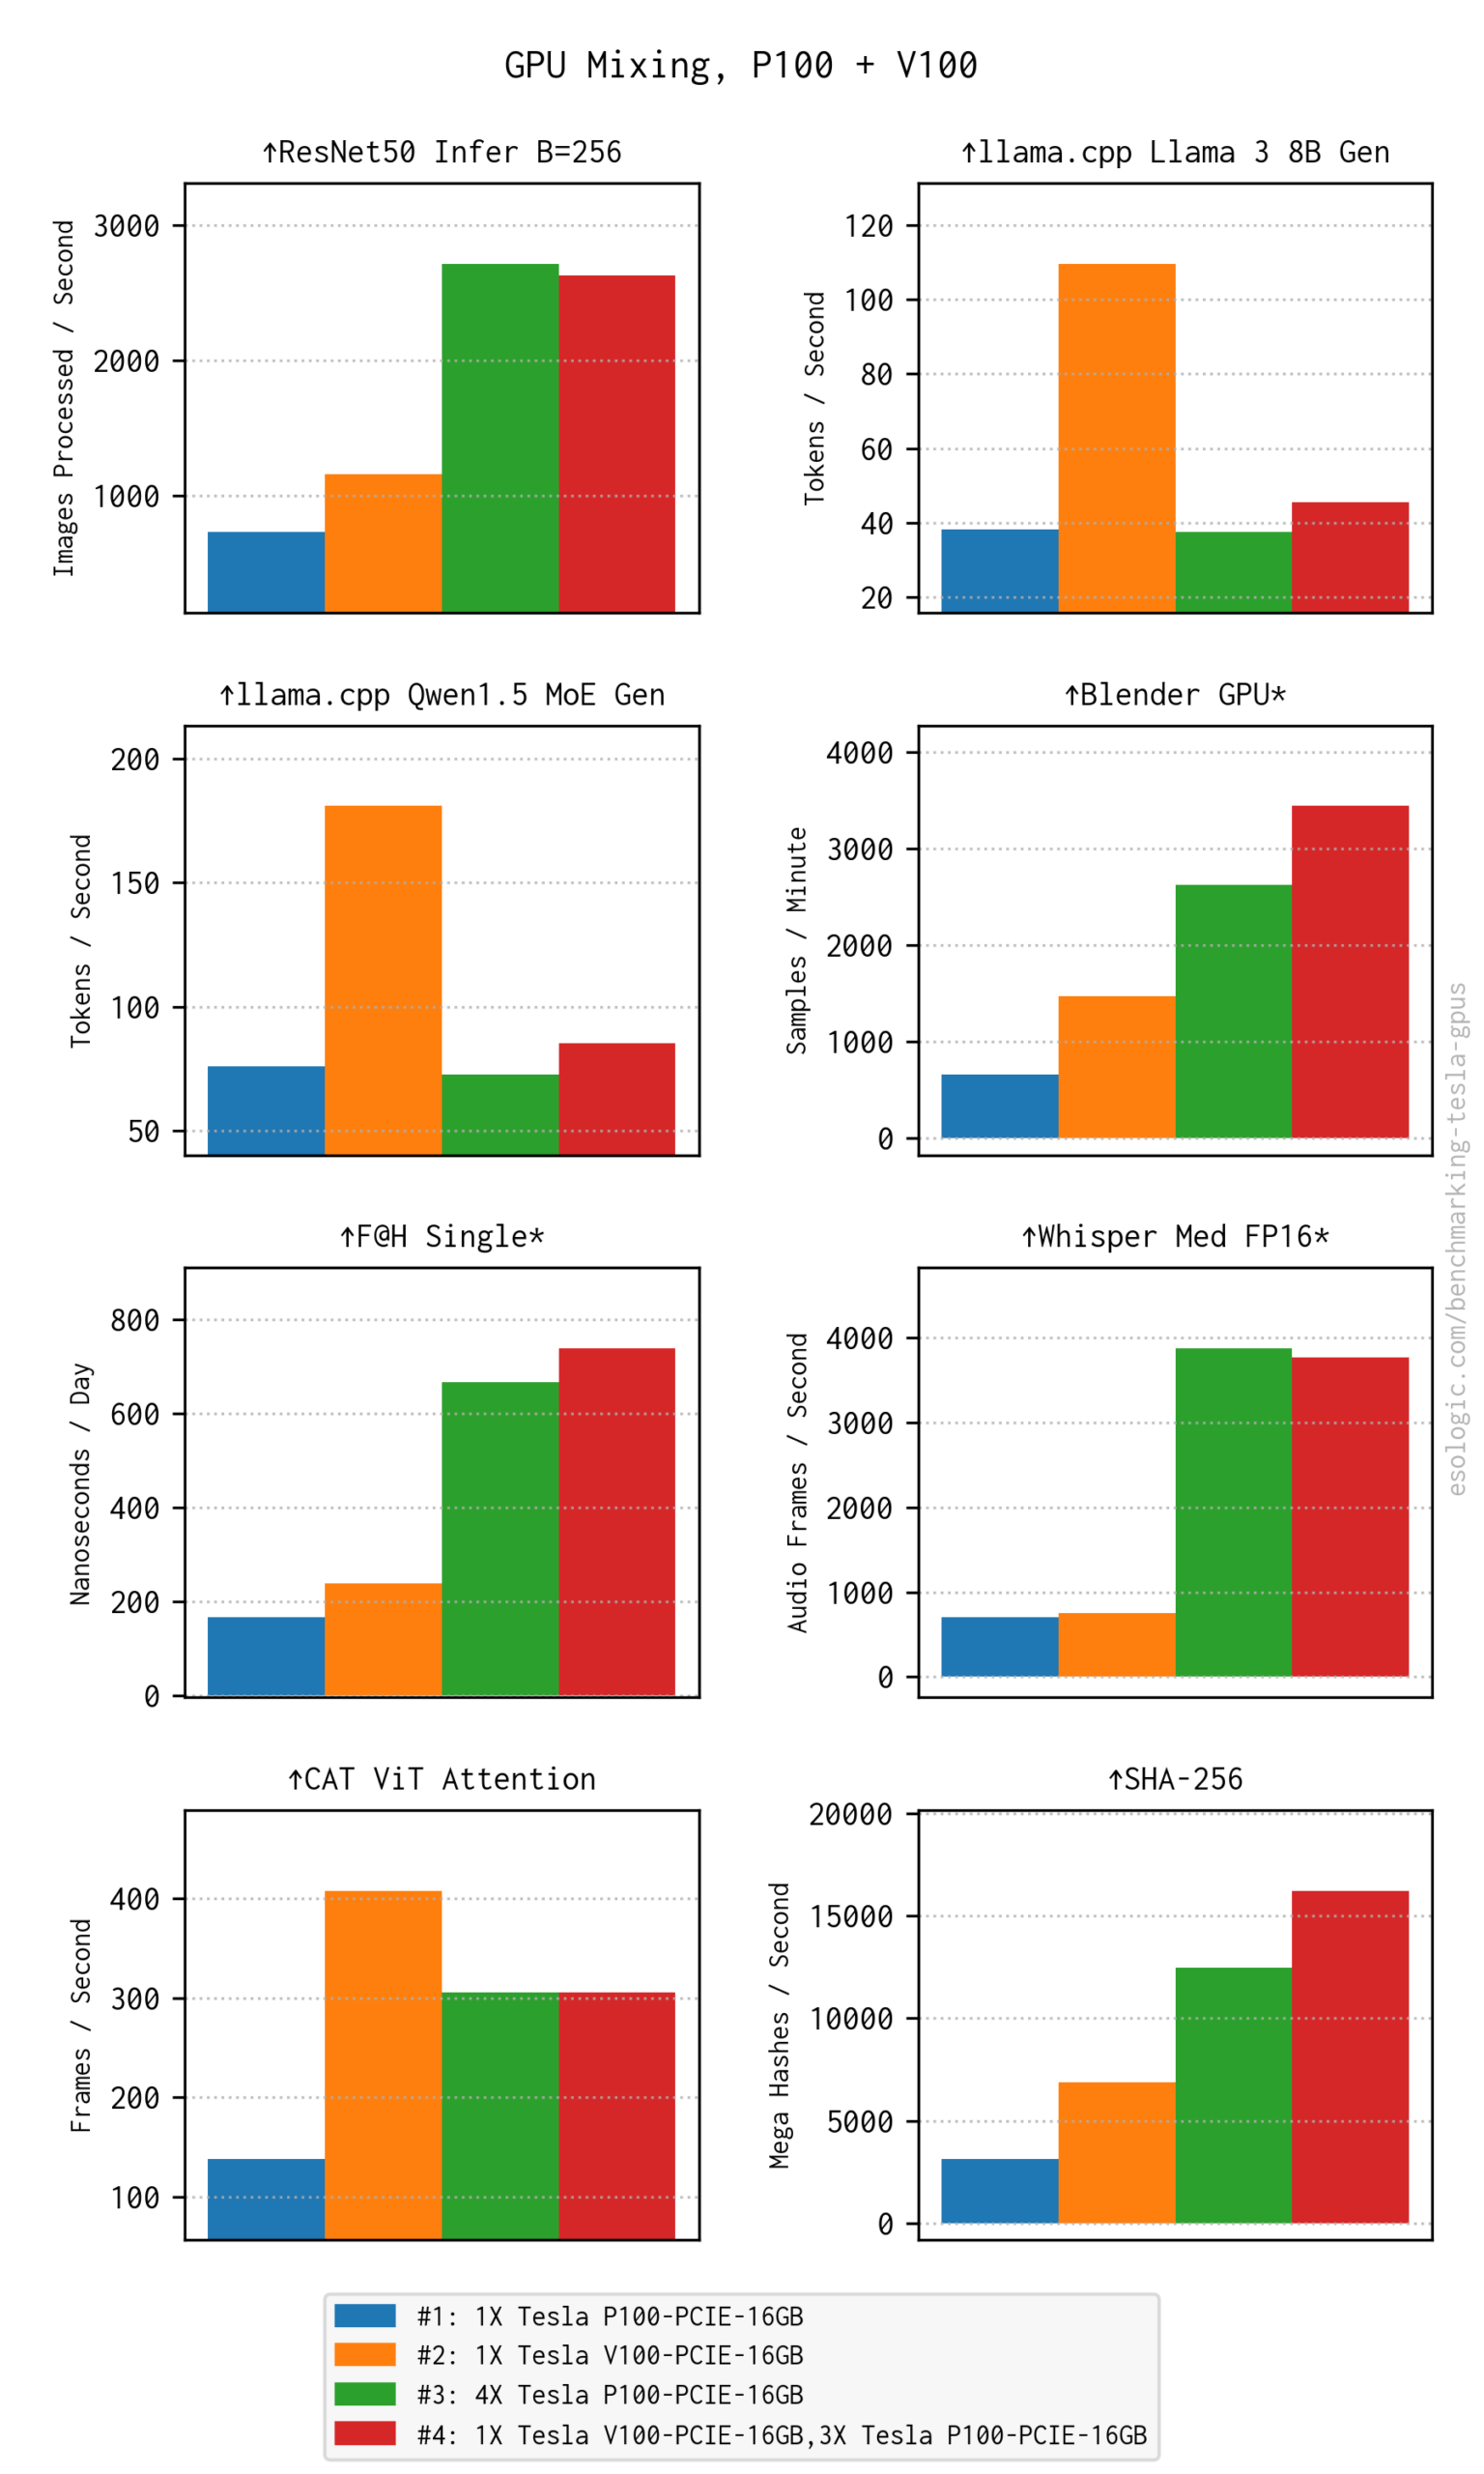
The V100 in the mix is held back significantly by the P100s in the LLM usecase. For the other tests, my takeaway is similar to the previous section: the more GPUs the better even if they’re mixed generation.
CPU Comparison
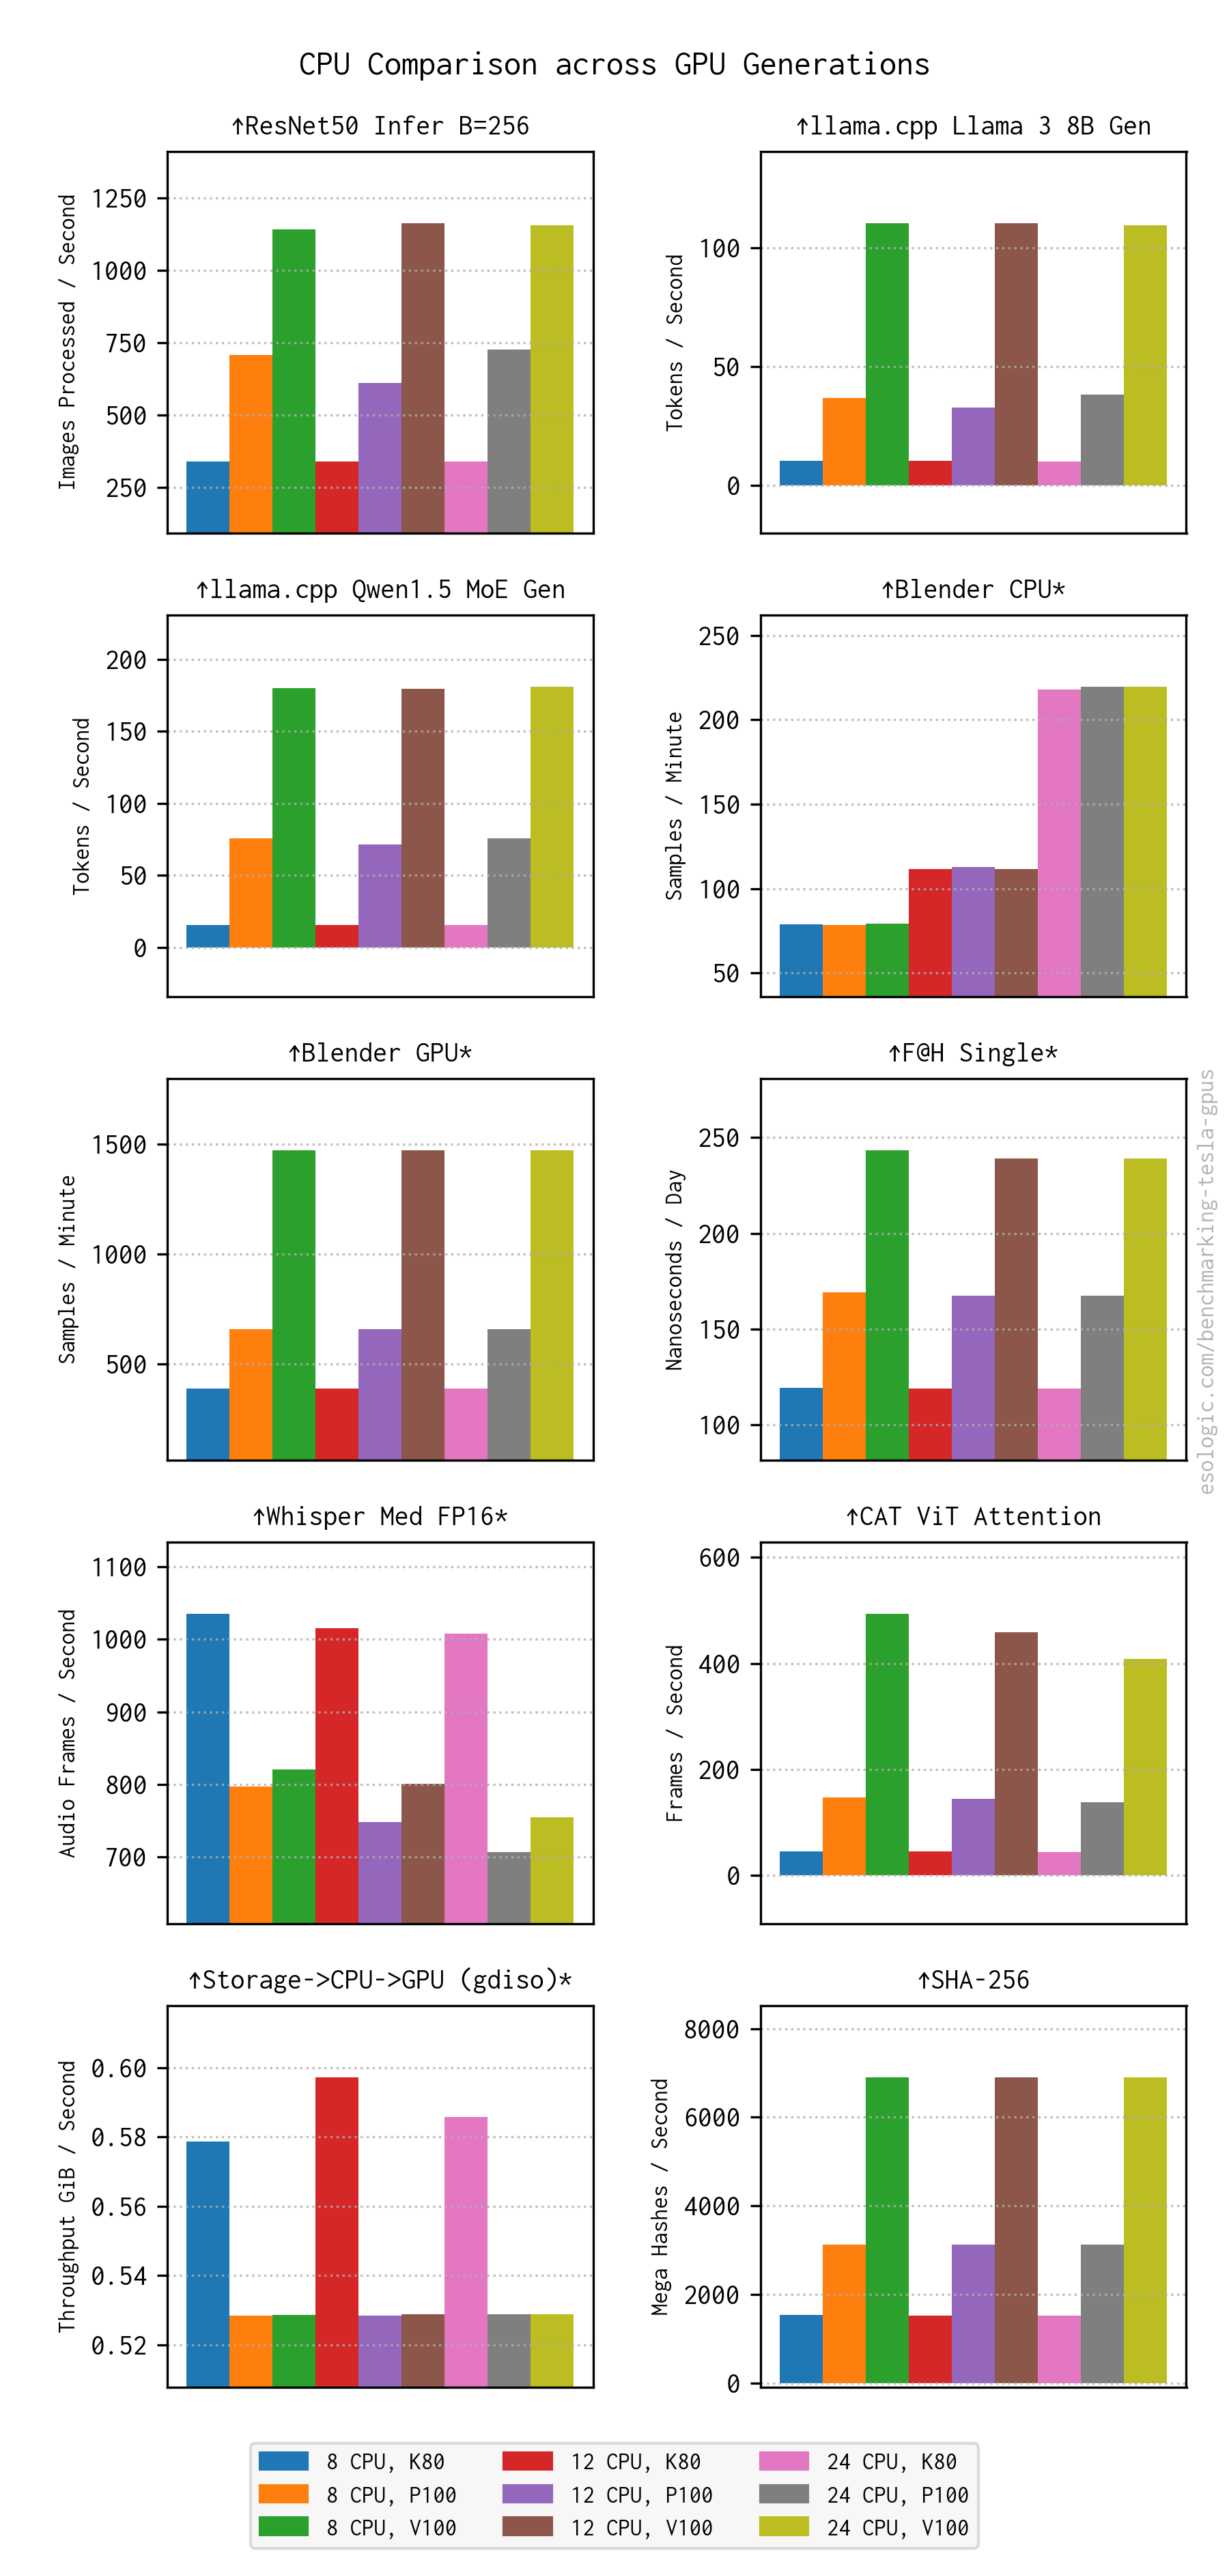
GPUs need to be fed by CPUs. In selecting a CPU, should we optimize for single core speed or total number of processors? The expectation is that better single core performance would lead to overall higher scores, but having more CPUs gives you more PCIe lanes and more GPUs.
Then broken out by GPU type:
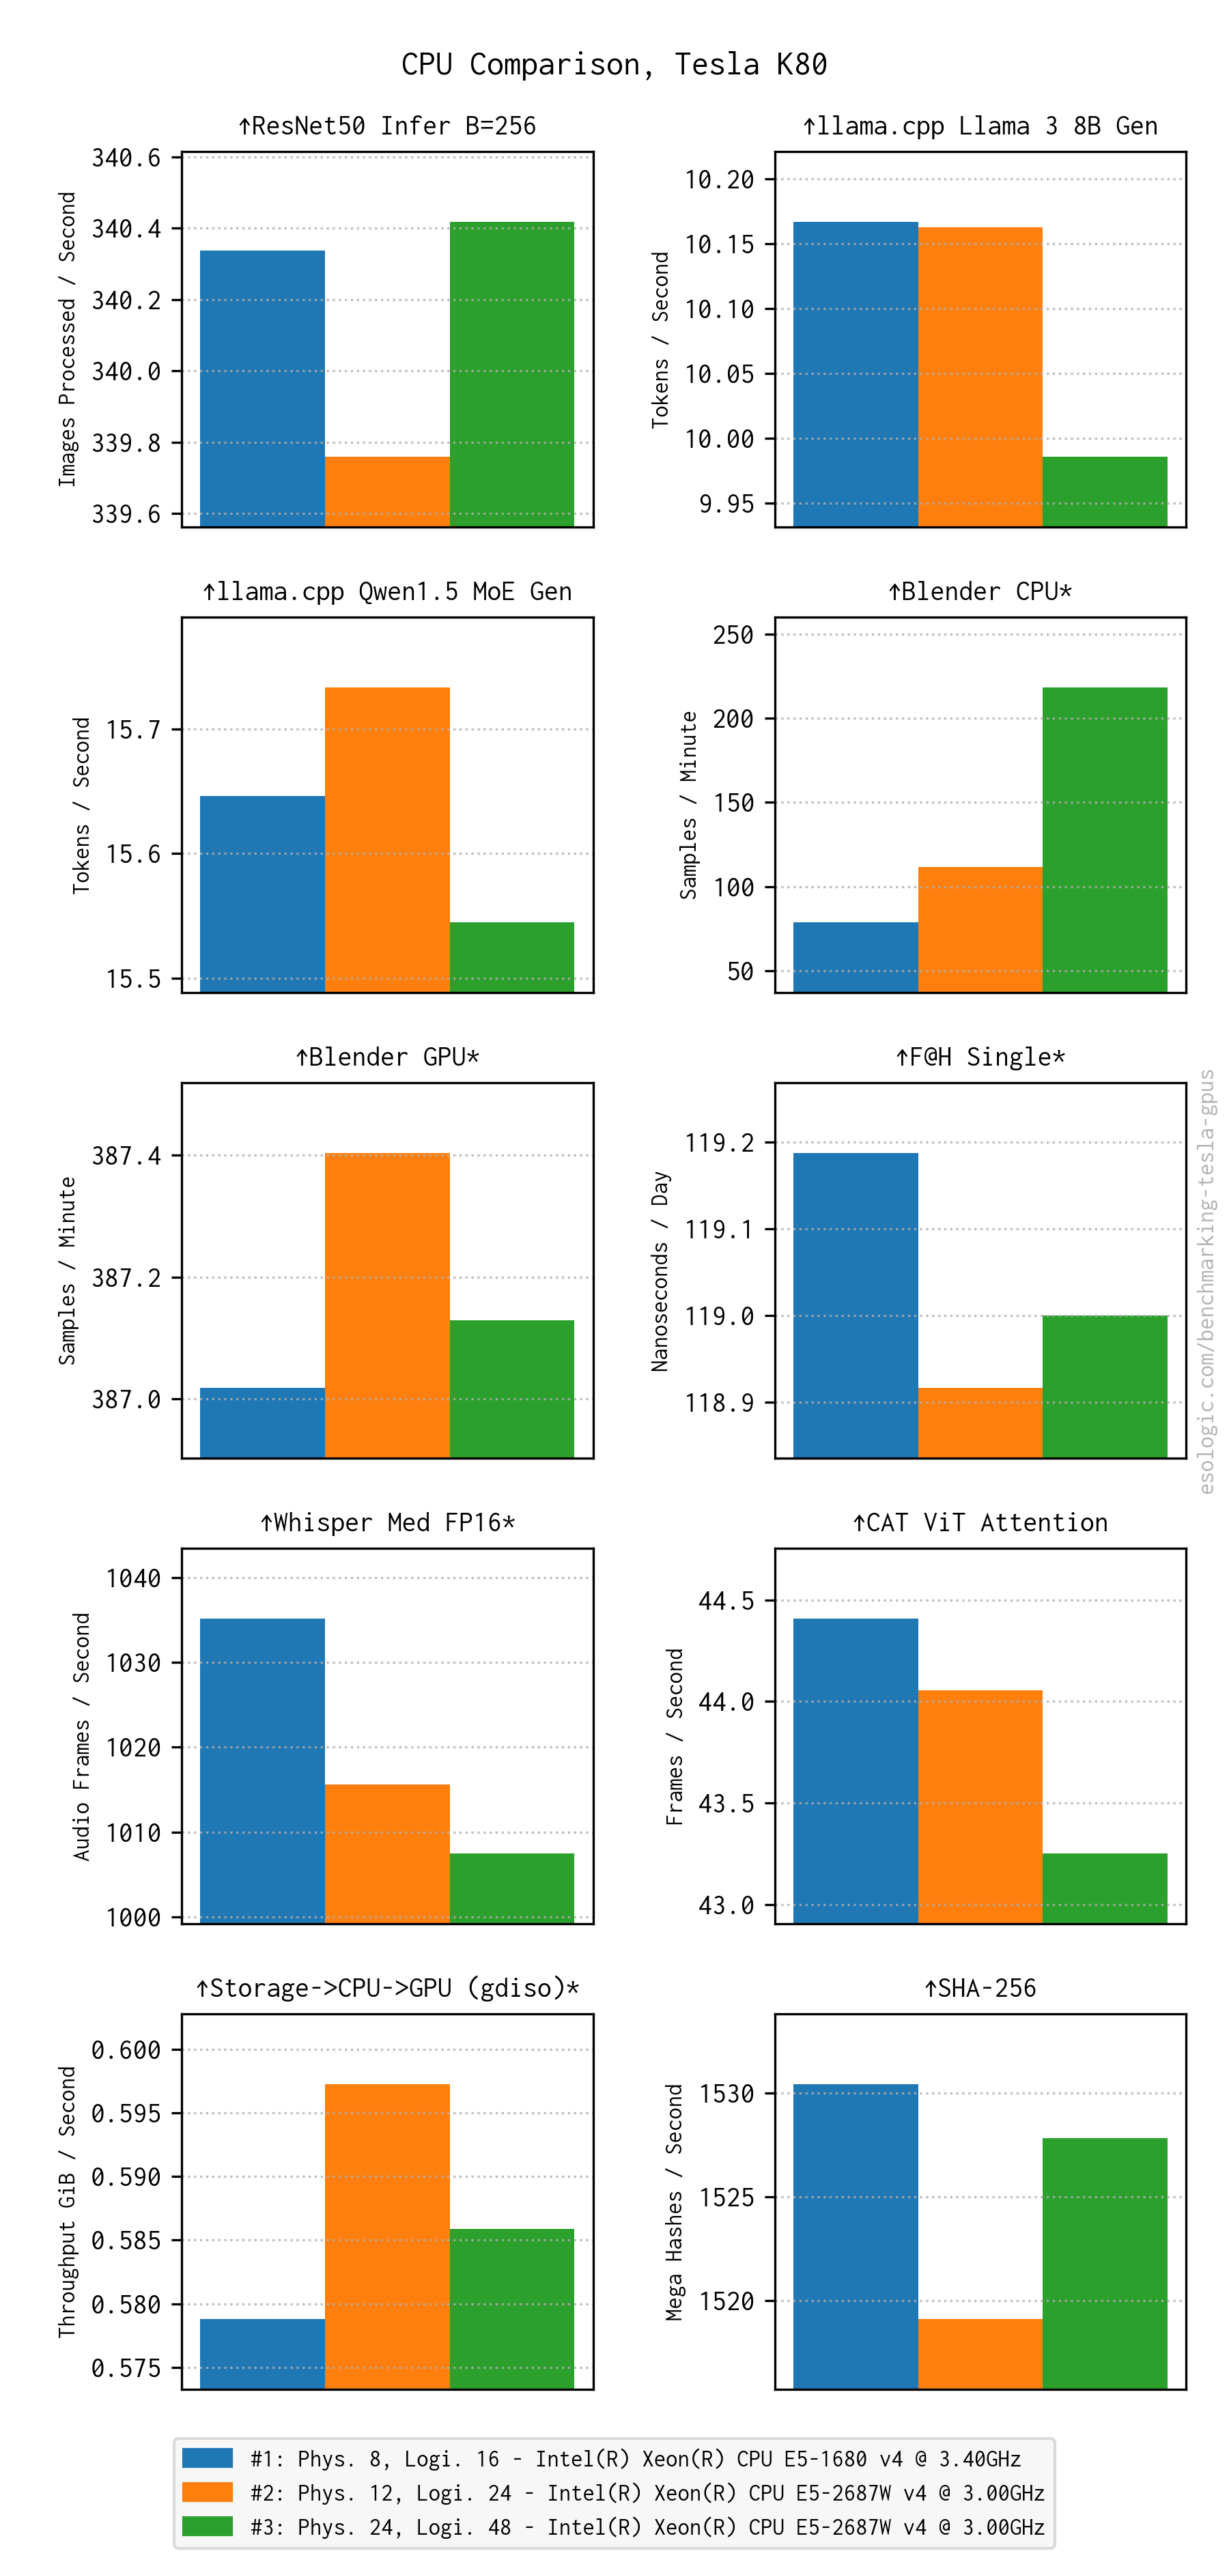
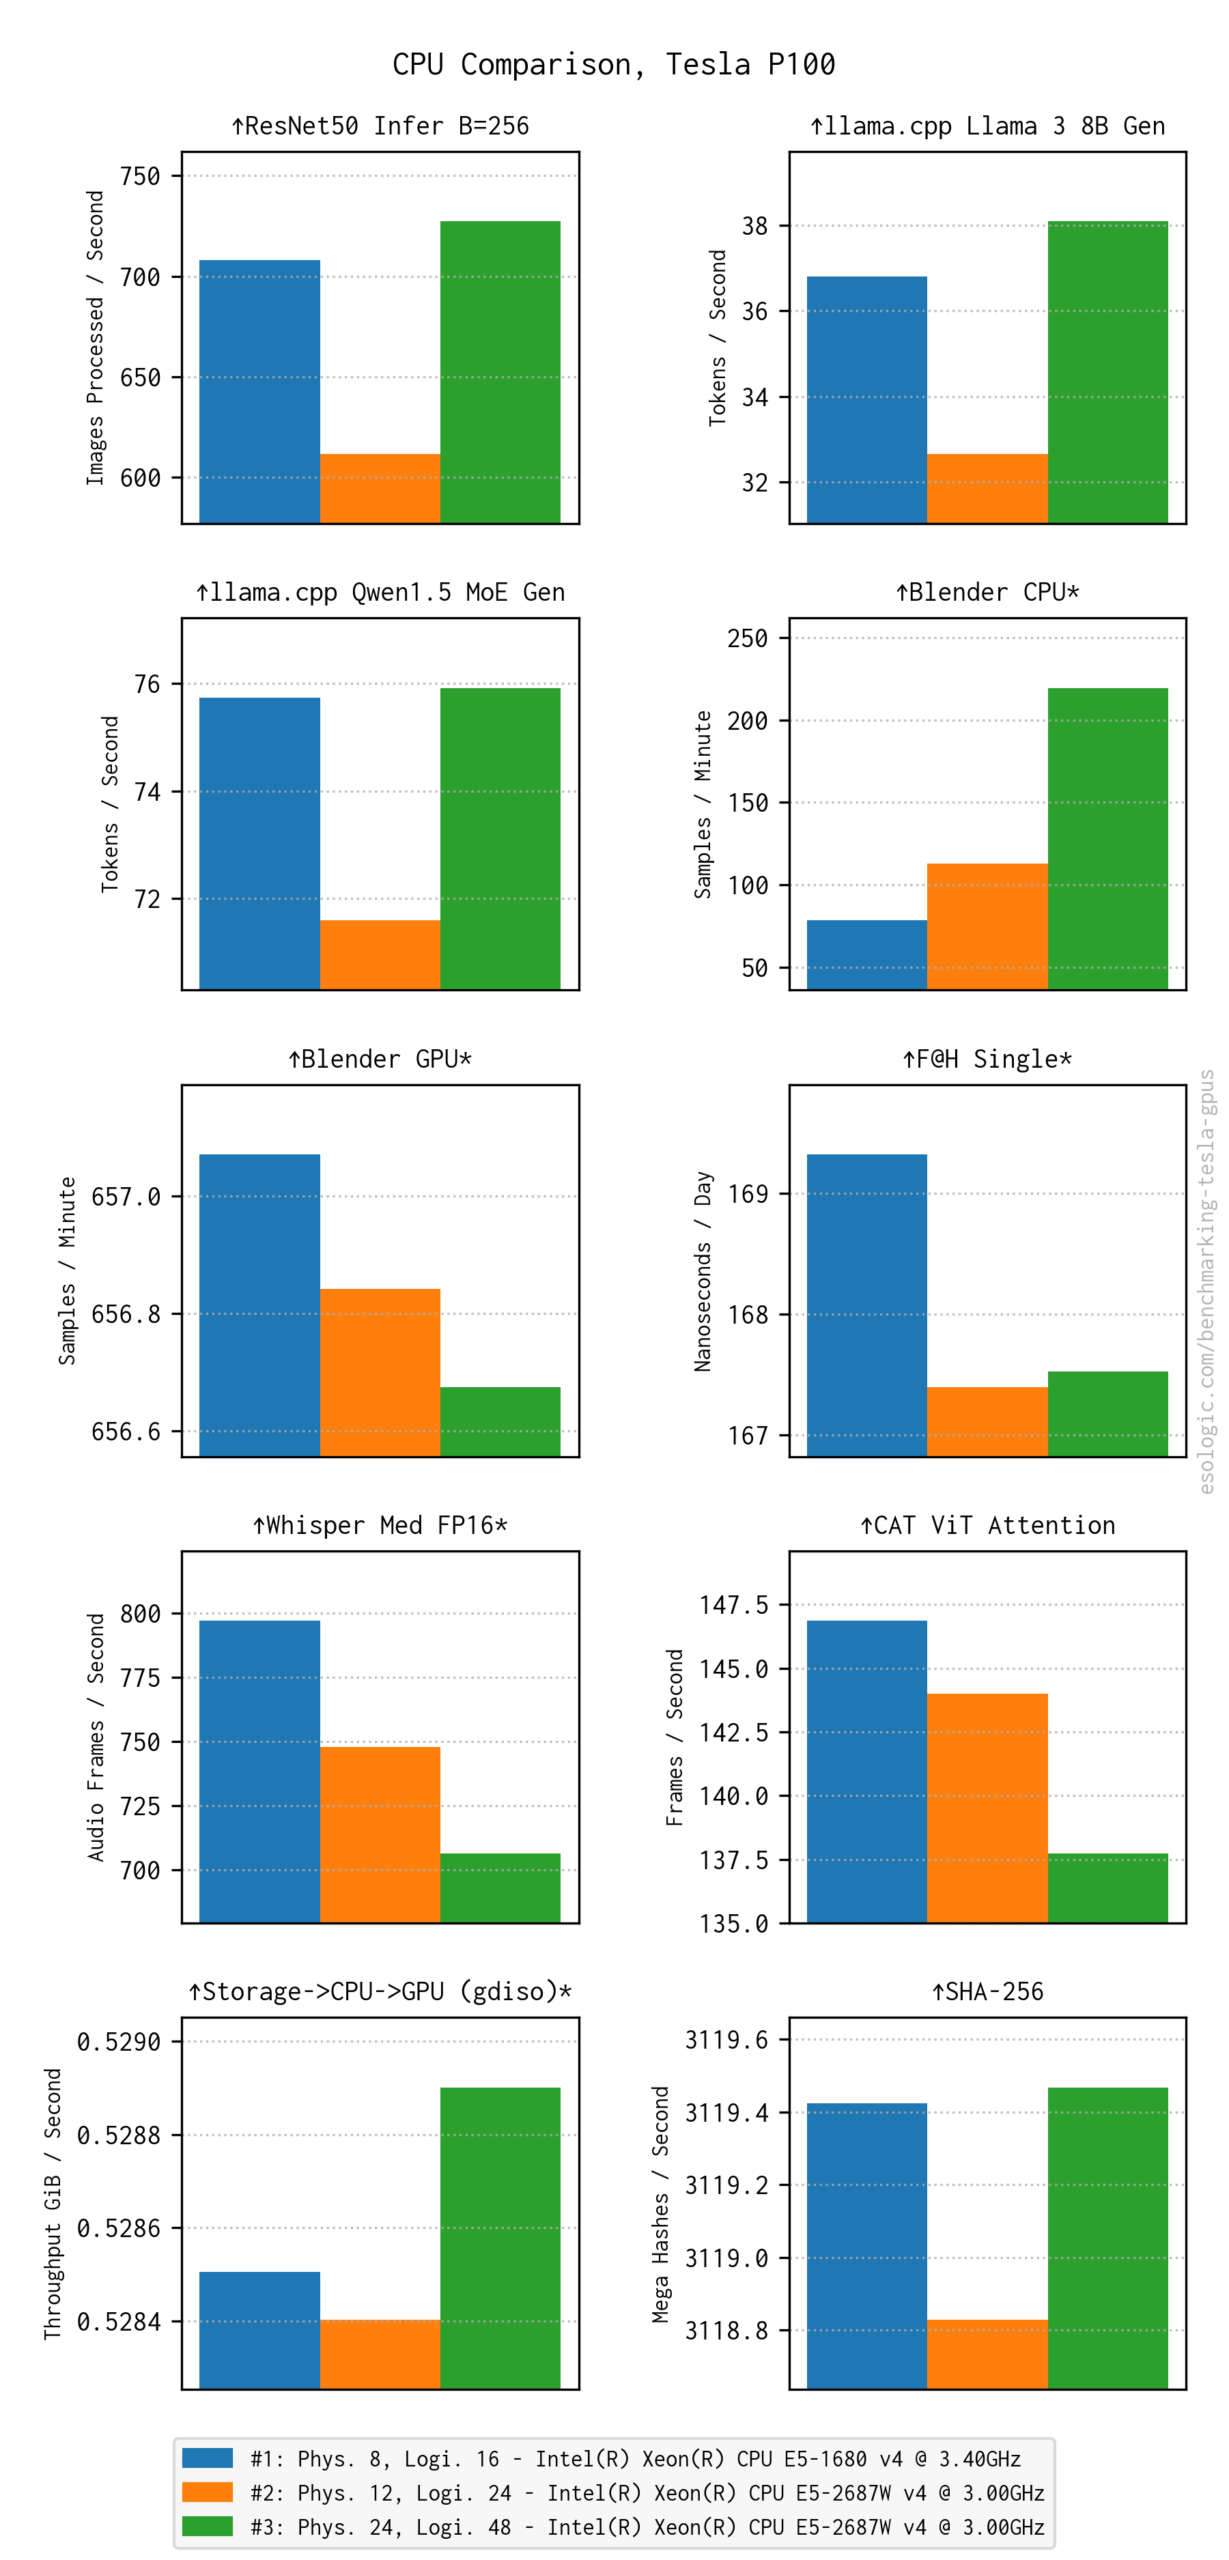
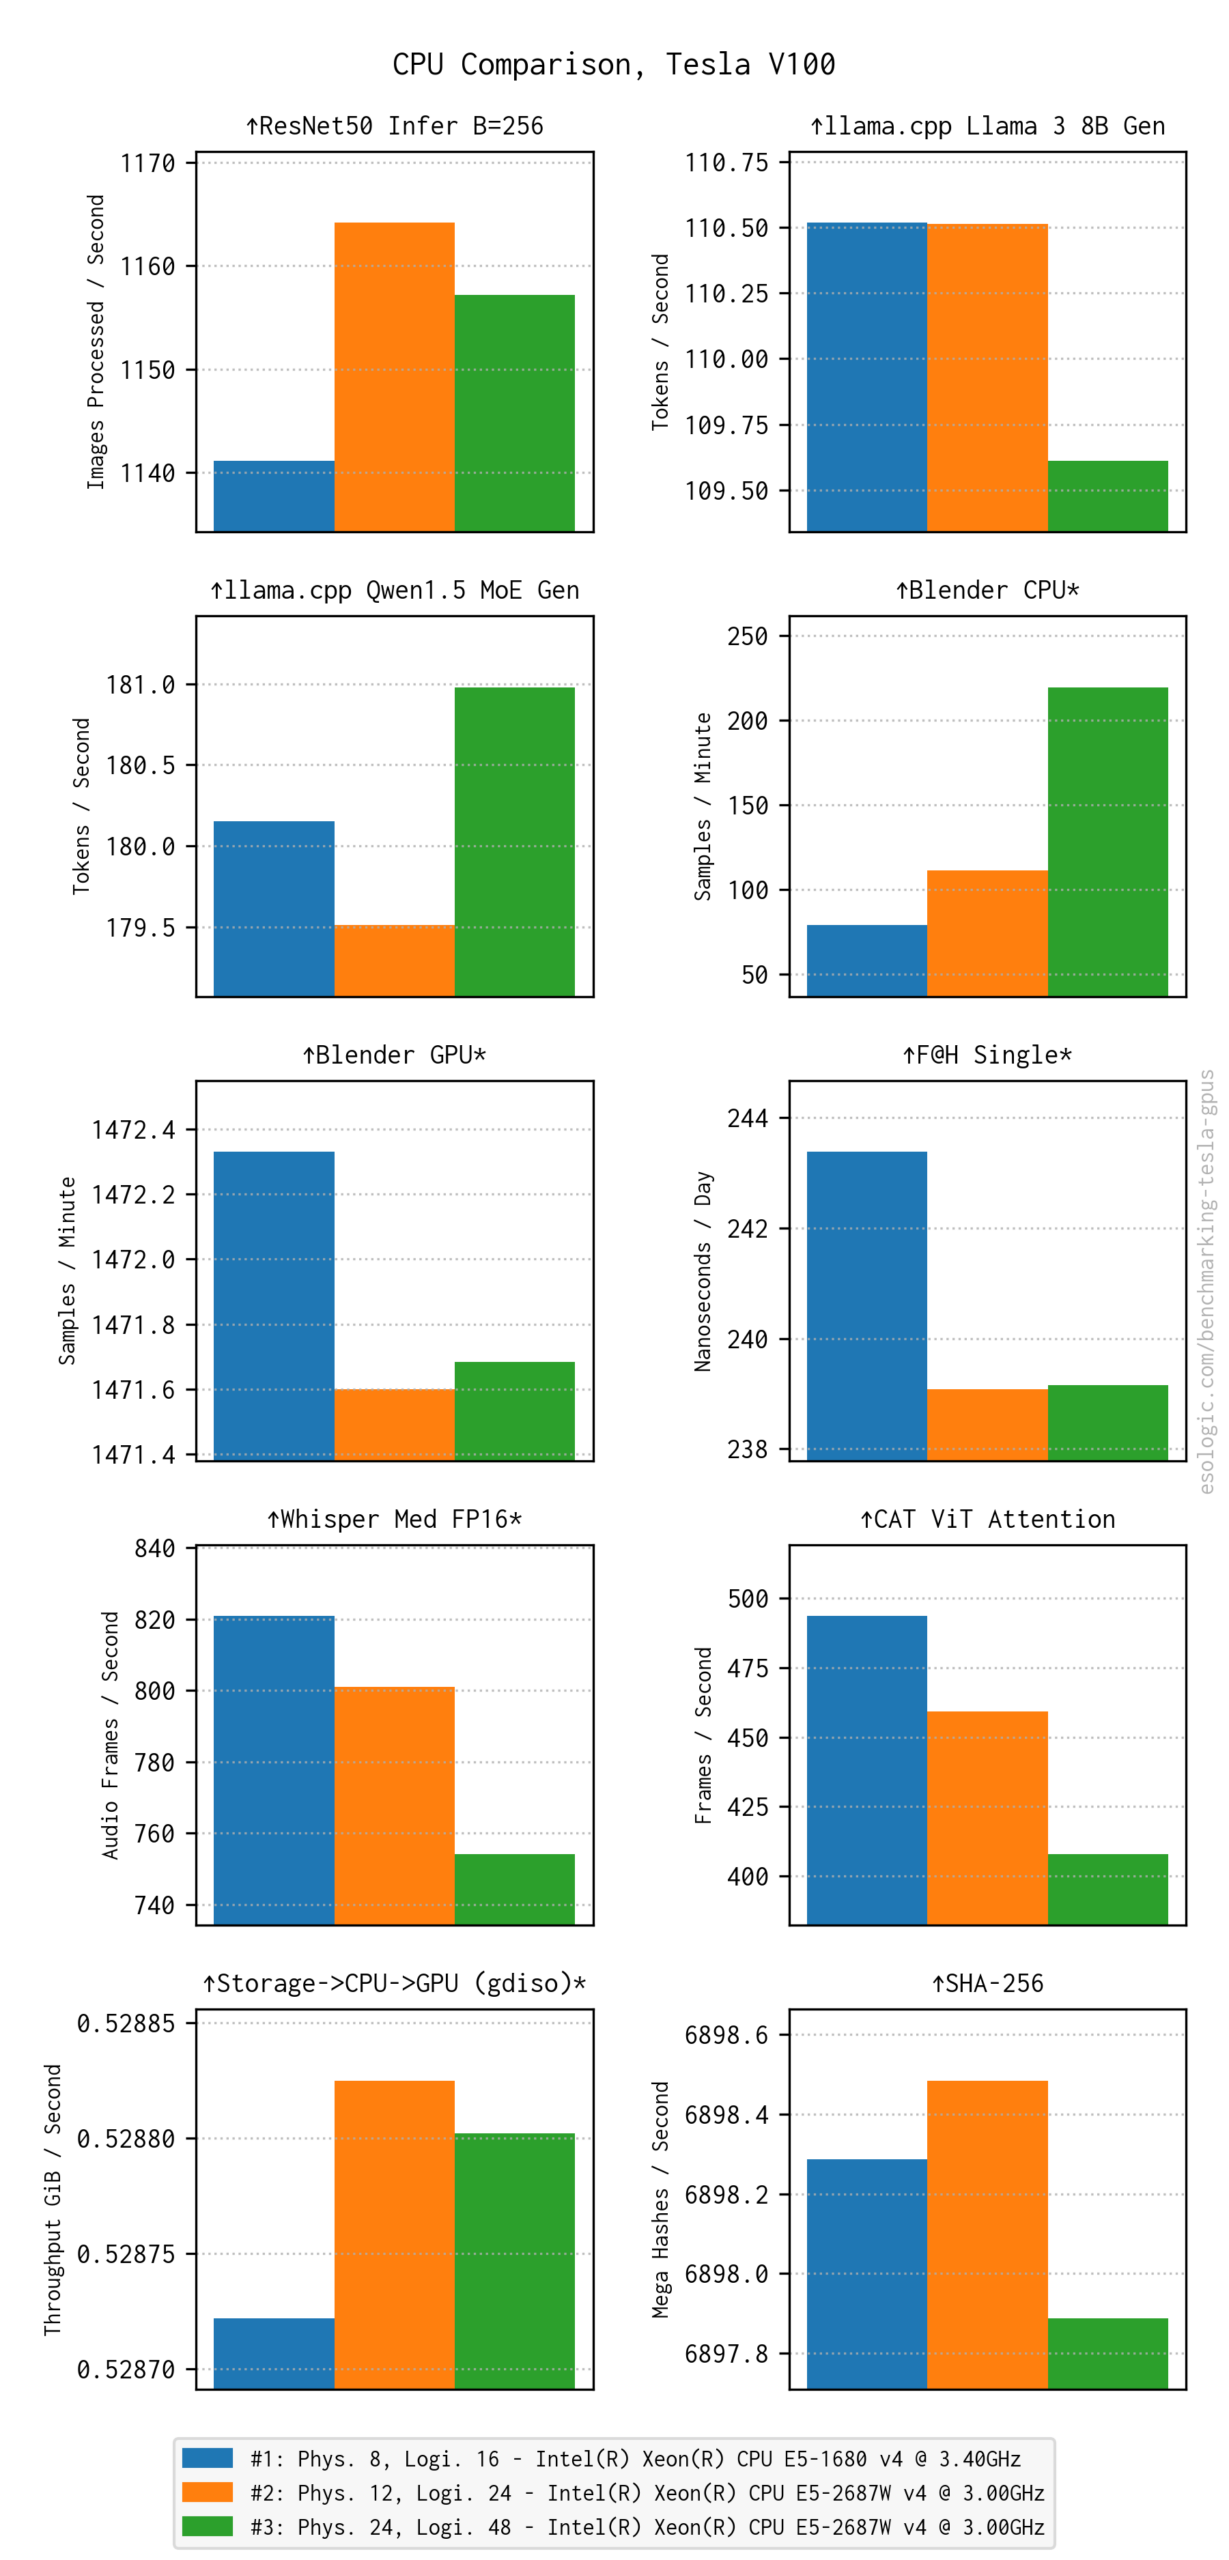
As expected, generally faster CPU cores result in better scores. The effect is small for the majority of results. However, for Whisper and CAT ViT Attention, there is absolutely a downward trend that maps to increasing core count and decreasing single core performance. For my personal usecase, this is an important finding which to discuss further in the final section.
Motherboard Comparison
Things like signal integrity problems or power delivery problems could show up by A/B-ing the motherboard. Both of the boards under test here are “Workstation” grade so I wasn’t expecting any difference in performance between the two motherboards.
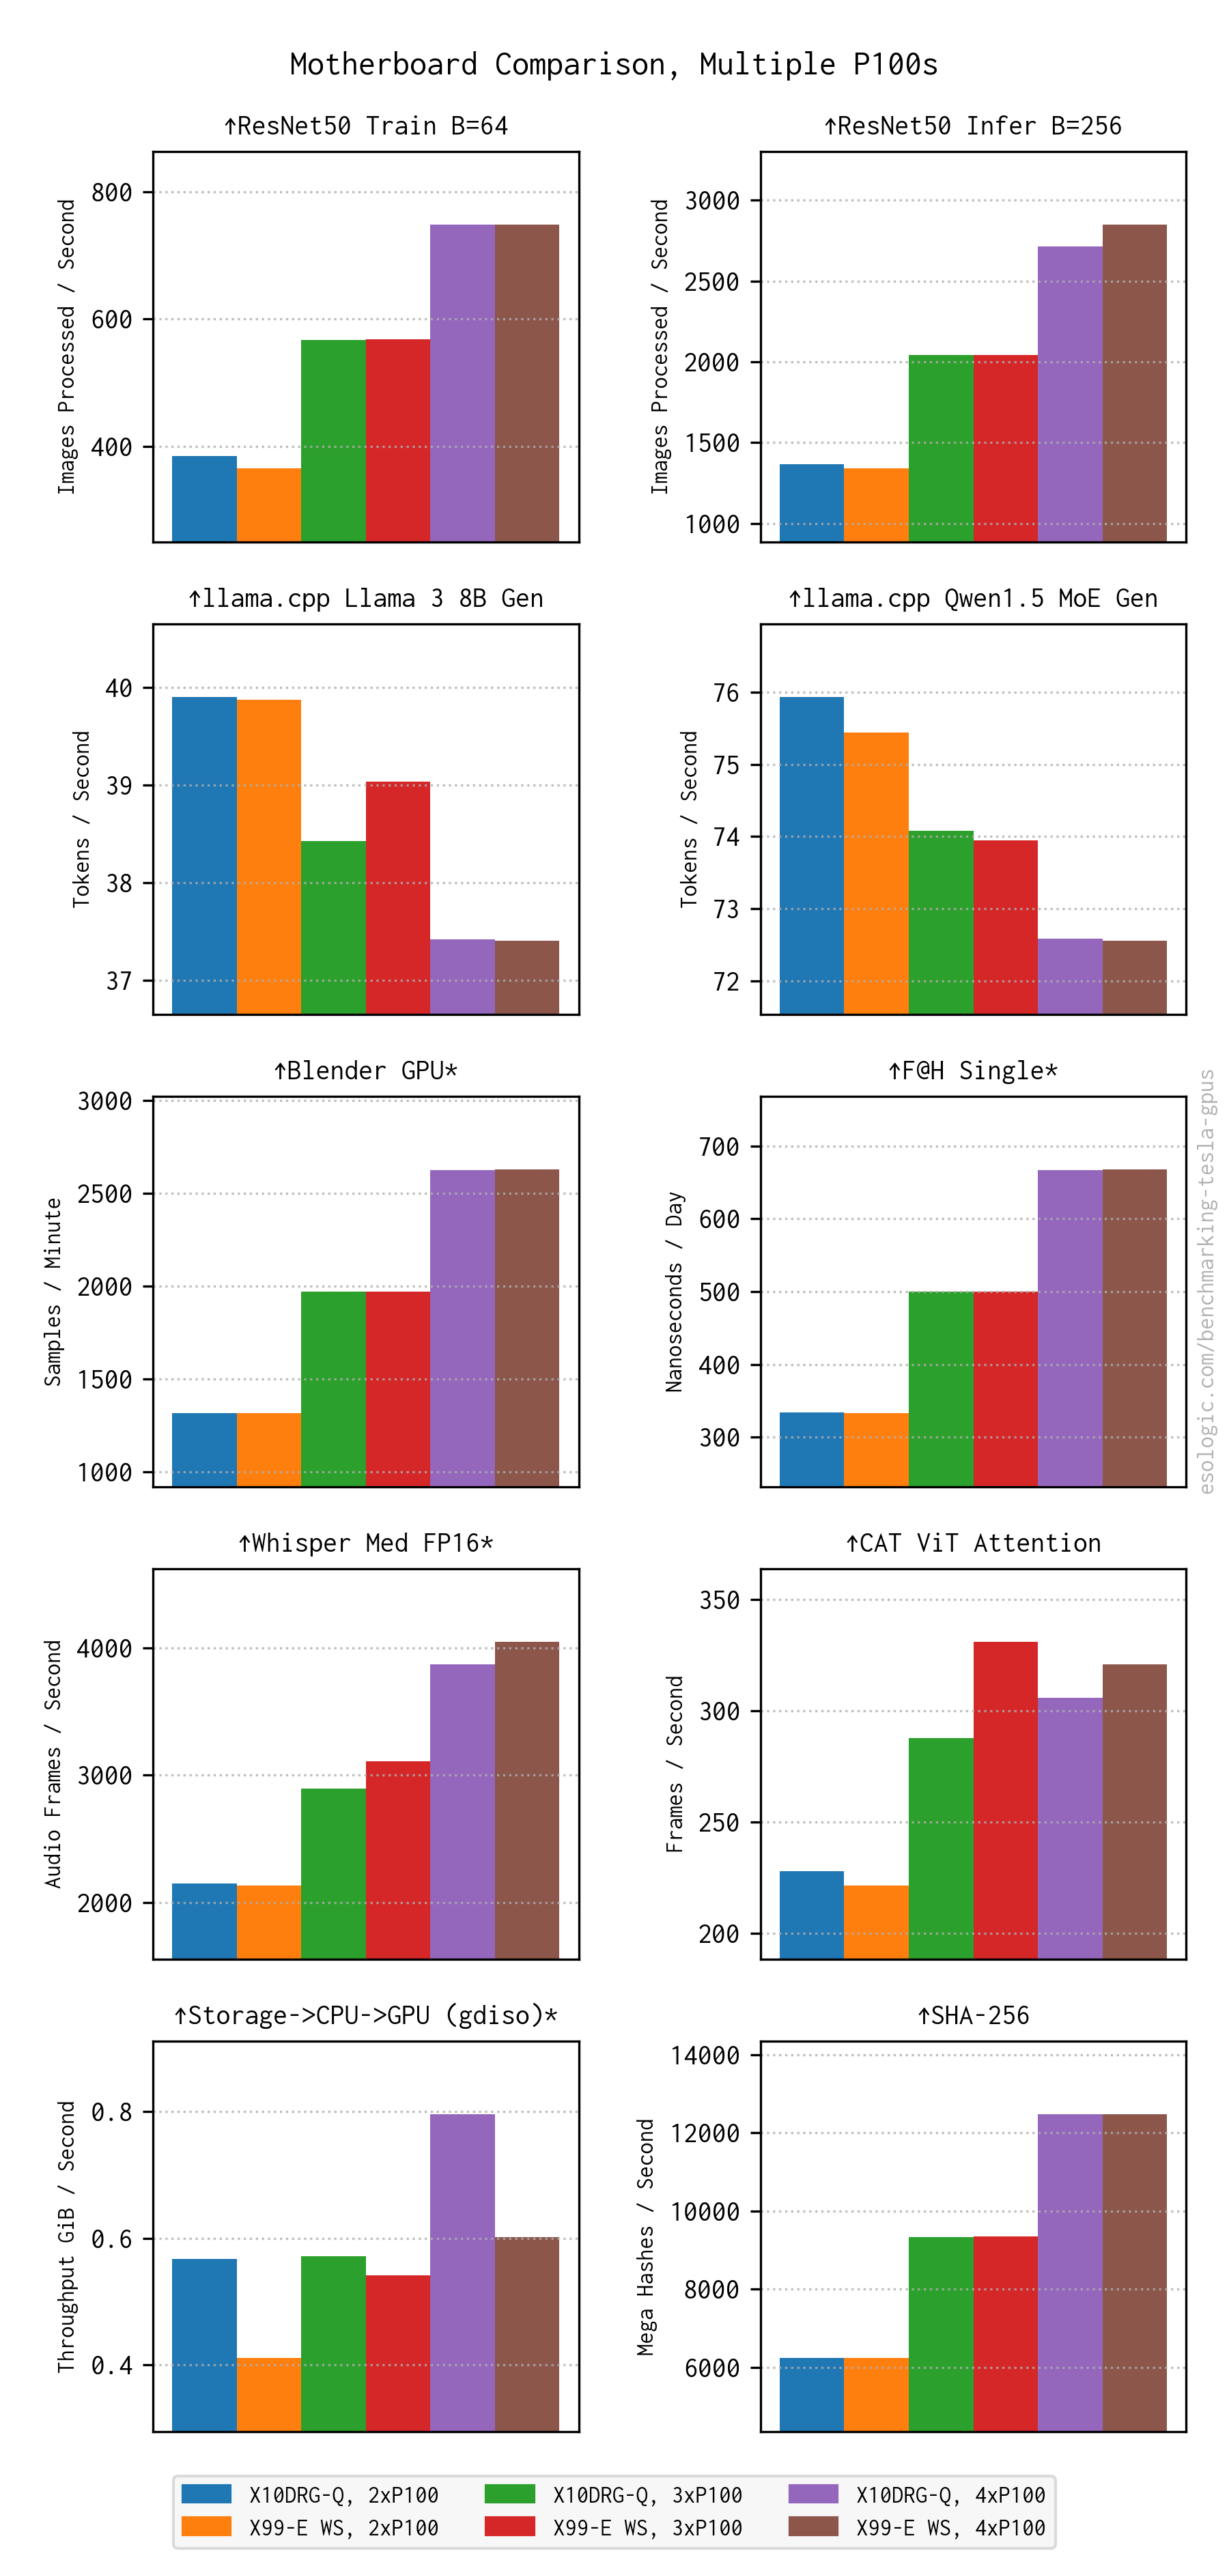
As expected, no major surprises. You can find really really cheap X99 motherboards on eBay and Aliexpress. I’ve actually had good luck with these but have never built a critical system around them. If you’re attempting this, please let me know and I could point you to some tests to run.
GPU Node BOM
The killer app requiring a GPU box for me is actually one of my own projects streamarize. This project takes longform livestreams (from twitch streams) and produces ready to upload YouTube videos with timestamps, descriptions and thumbnails. It also produces “reels”-style short form videos made up of a sped-up version of the broadcast. The core components to streamarize are Whisper, Ollama and Content Aware Timelapse.
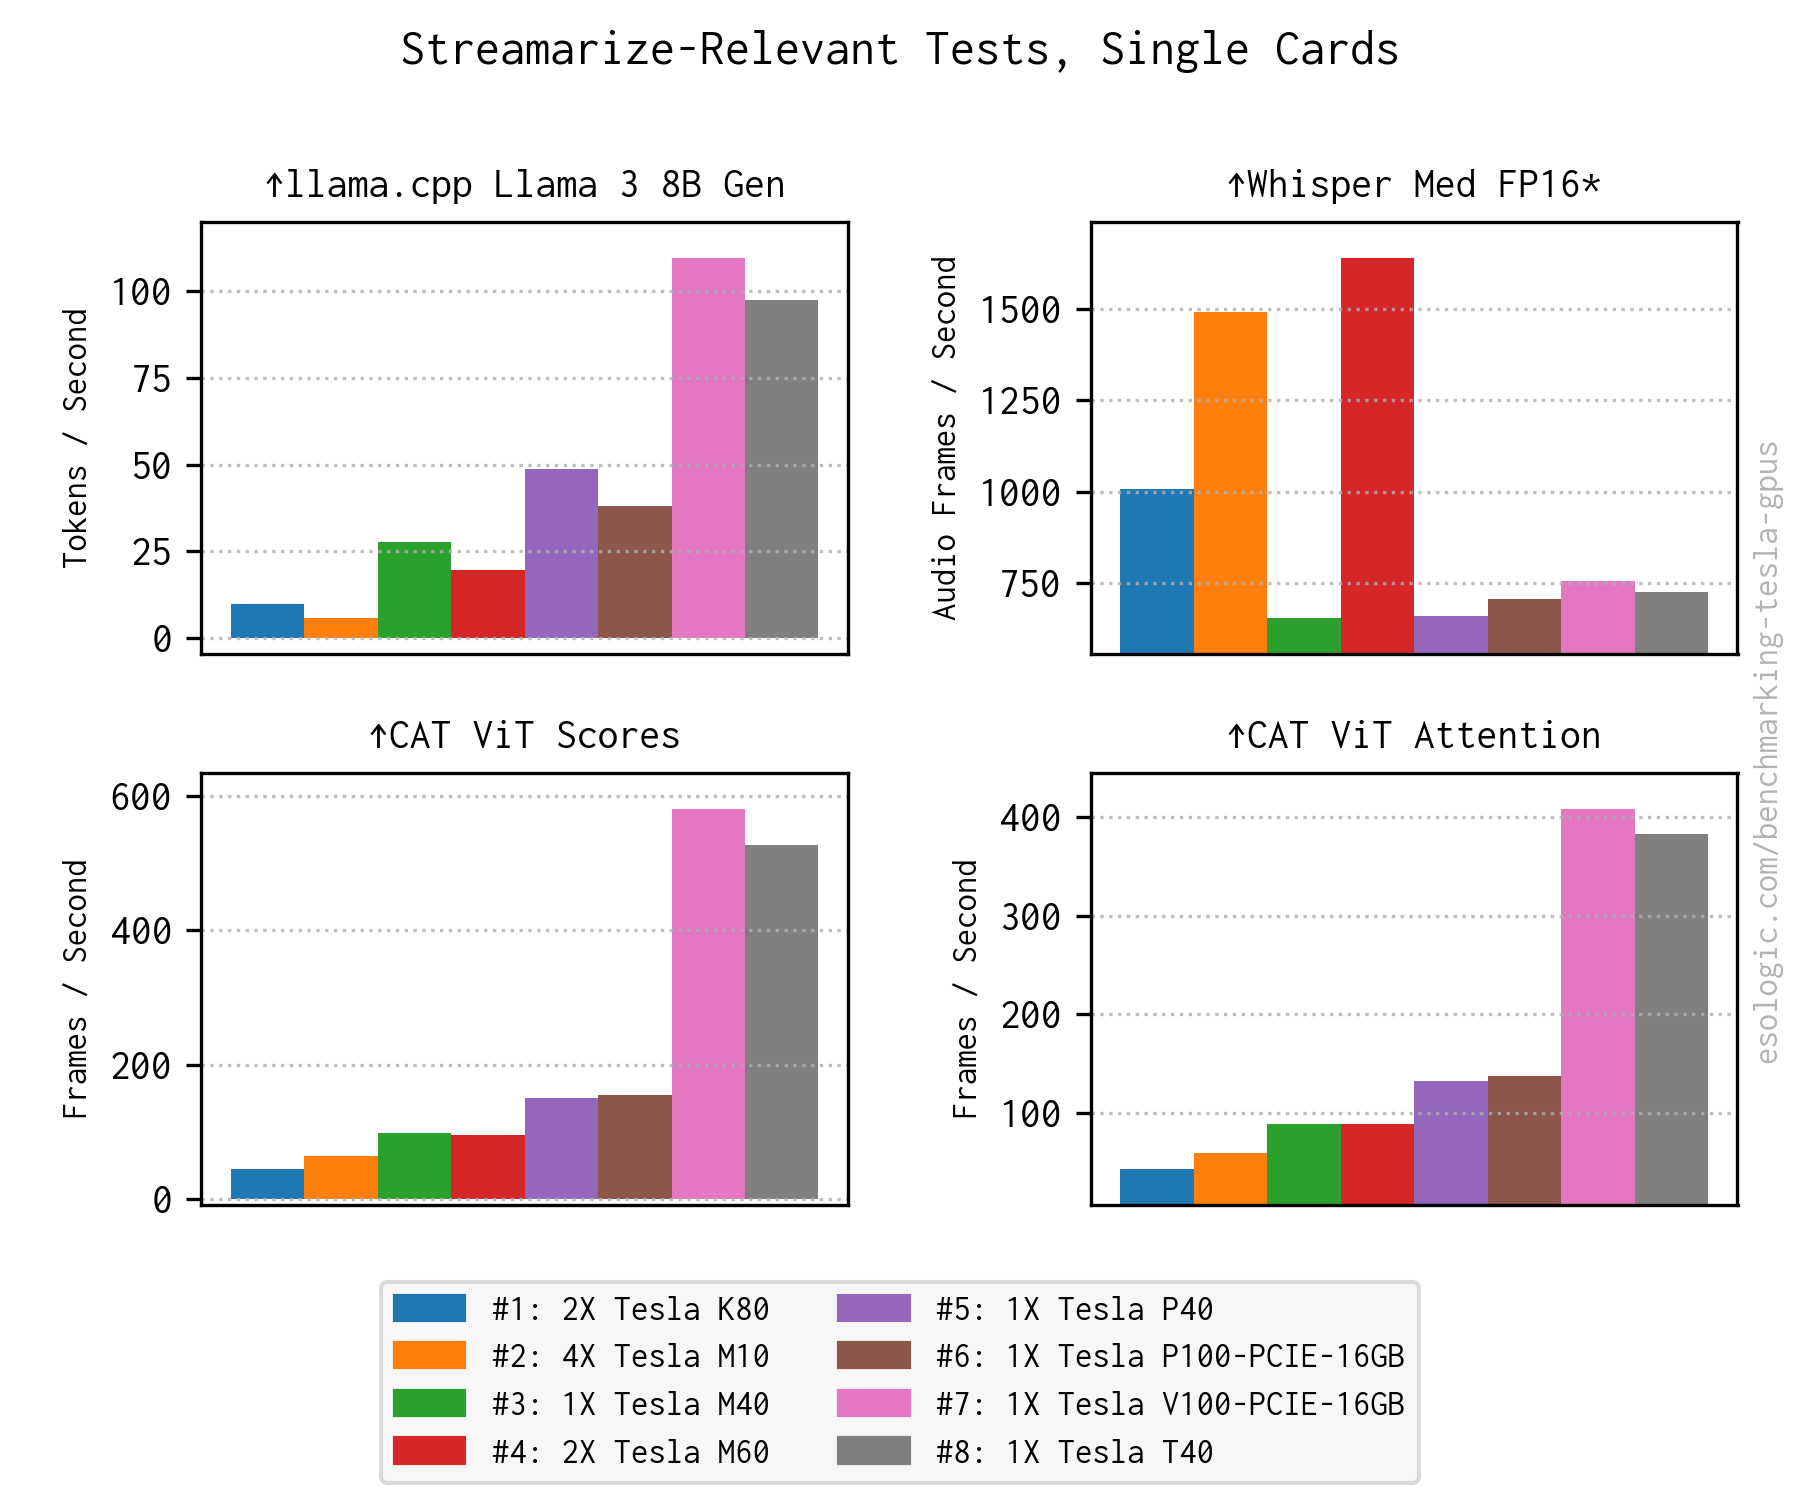
M60 may have exceptional Whisper throughput but to me the winning GPU is V100. For CPU and Motherboard, I’ll start off by trying out a single E5-1680 8-Core with the Asus X99-WS motherboard. Theoretically this should be able to support 3x V100s, leaving room enough for a 10GB NIC.
Next Steps
I have the setup now to add more tests or test more hardware. Anything major I missed to better benchmark tesla GPUs? Leave a comment! Next steps are to acquire the missing hardware and build the system.
Thanks for reading!
Hullo,
Which case did you use ?
I have several Rack Mount Servers and really need to save on the heat the generate, so I’m looking into an regular PC case server build.
For the testing I used an OpenBenchTable but for my actual build I’m going to use the Sliger CX4200A with my fan mod.
If you are looking to have the board and multiple cards contained in a case, then I would recommend the Phanteks Ethoo Pro Full Tower case. It will accommodate the board and supplies you are leaning toward and is quite cost-effective. I have used it with workstation motherboards as well as both my current AM4 and previous Intel setups.
A beast! Thanks for the rec.