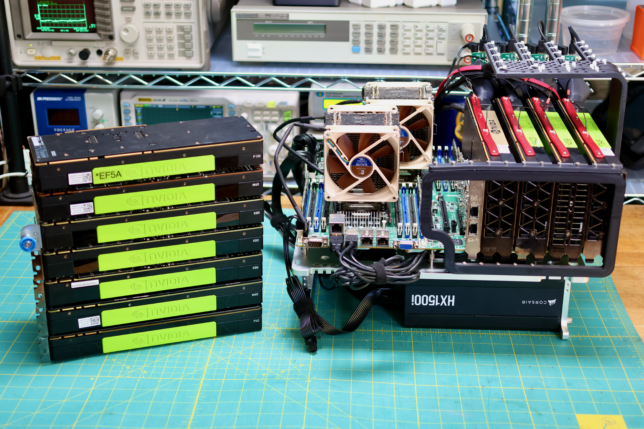
Previously a plan was set in motion to benchmark my collection of mighty Tesla GPUs. The set of cooler manifolds are designed, a GPU server benchmark suite has been created, and the time has come to start working through the spreadsheet. I have long suspected that the older multi node cards could be fantastic for image processing. Finally we can quantify how much life is left in these older cards.
As it stood, the three main features that would comprise the upcoming collaboration with Won Pound (slated for release mid-April) were:
Projection Files (using a styleGAN2 network to project each of the individual frames in a source video, resulting in a series of latent vectors that can be manipulated and fed back into the network to create synthetic videos)
Audio Blending (using alpha compositing to combine a frequency domain representation of an audio signal with a series of projected vectors)
Network Switching (feeding the same latent vector into multiple networks produced in the same training run, resulting in visually similar results)
As detailed in the previous post. The effect of these three features can be seen in this demo:
Knowing we had enough runway to add another large feature to the project, and feeling particularly inspired following a visit to Clifford Ross’ exhibit at the Portland Museum of Art, I began exploring the relationship between the projection source video and the output images synthesized by the network.
VisPy is a Python library for interactive scientific visualization that is designed to be fast, scalable, and easy to use.
While looking for a near real time data visualization alternative to the venerable matplotlib, I came across this jaw dropping demo:
Absolutely insane, achieving that kind of performance in python is amazing to say the least. This demo in particular seems like it would be more likely to come from a pygame application at the least, but looks more like it would be a Unity project.
The VisPy project is massive, but luckily, there is a set of really good examples included in the repo. Reminds me of the Arduino standard library in this way. After through all of running these, I didn’t find exactly what I was looking for.
For how simple the finished product looks, the learning curve on the way there was surprisingly steep. Hopefully this post saves you some time.
Trying to get the most out of a day has been big theme of my life lately, as I’m sure it is for many people. I’ve found that I always manage my time better when things are urgent; I’m considerably more productive when I have to be.
I want an ascetically pleasing way to be able to represent how much time is left in the day at a granular scale, like an hourglass. Watching individual seconds disappear will look cool and (hopefully) create that sense of urgency that I want to induce.
Technically, this is a really simple thing to accomplish thanks to python and pygame. Here’s a video of a proof of concept running on my laptop:
At the start of each day, the display is filled with squares at random locations, with a random color. As each second elapses, a square will vanish.
To make it easier to see for the video, I’ve made the squares much bigger than they will actually be for the final build. This is what the display looks like with the squares at their actual size:
The code really really simple, like less than 100 lines simple. Here’s how it works:
Here’s the version of the code running on my computer in the video:
import pygame
from random import randint
from apscheduler.schedulers.blocking import BlockingScheduler
import datetime

class random_square(object):
    def __init__(self, max_x_location, max_y_location):

        self.x_loc = randint(0, max_x_location)
        self.y_loc = randint(0, max_y_location)

        max_color_value = 255

        red = randint(0, max_color_value)
        green = randint(0, max_color_value)
        blue = randint(0, max_color_value)

        self.color = [red, green, blue]


class clock(object):
    def __init__(self, initial_count, max_count, screen_w, screen_h):

        self.max_count = max_count
        self.screen_w = screen_w
        self.screen_h = screen_h

        # create the screen object, force pygame fullscreen mode
        self.screen = pygame.display.set_mode([screen_w, screen_h], pygame.FULLSCREEN)

        # the screen's width in pixels is stored in the 0th element of the array
        self.square_size = screen_w / 200

        # create the list of squares, initially as empty
        self.squares = []

        # fill the squares with the inital seconds until midnight
        for second in range(initial_count):
            self.squares.append(random_square(screen_w, screen_h))


    # starts ticking the clock
    def start(self):
        scheduler = BlockingScheduler()
        scheduler.add_job(self.tick, 'interval', seconds=1)
        try:
            scheduler.start()
        except (KeyboardInterrupt, SystemExit):
            pass

    # this occurs once every time a unit of time elapses
    def tick(self):
        # this will happen once per "day"
        if len(self.squares) == 0:

            # fill the list of squares to be drawn
            for second in range(self.max_count):
                self.squares.append(random_square(self.screen_w, self.screen_h))

        # draw a blank screen
        self.screen.fill([0, 0, 0])

        # draw the squares
        for square in self.squares:
            rect = (square.x_loc, square.y_loc, self.square_size, self.square_size)
            pygame.draw.rect(self.screen, square.color, rect, 0)

        pygame.display.update()

        # remove a single square from the list as one tick has elapsed
        self.squares.pop()

# initialize pygame
pygame.init()

# figure out the parameters of the display we're connected to
screen_width = pygame.display.Info().current_w
screen_height = pygame.display.Info().current_h
screen_size = screen_width, screen_height

# determine the number of seconds until midnight
seconds_in_a_day = 86400
now = datetime.datetime.now()
midnight = now.replace(hour=0, minute=0, second=0, microsecond=0)
seconds_until_midnight = seconds_in_a_day - (now - midnight).seconds

# create and start the clock!
cl = clock(seconds_until_midnight, seconds_in_a_day, screen_width, screen_height)
cl.start()
Let’s walk through some of the design decisions of this code. The first thing that’s worth talking about is how the data for the squares is handled:
class random_square(object):
    def __init__(self, max_x_location, max_y_location):

        self.x_loc = randint(0, max_x_location)
        self.y_loc = randint(0, max_y_location)

        max_color_value = 255

        red = randint(0, max_color_value)
        green = randint(0, max_color_value)
        blue = randint(0, max_color_value)

        self.color = [red, green, blue]
It’s just an object with no methods, and on initialization, all the parameters of the square (location and color) are generated randomly as opposed to just floating the raw numbers in arrays around (even though that’s basically what is happening). This let’s us fill the squares array very easily later on in the file here:
# fill the squares with the inital seconds until midnight
for second in range(initial_count):
    self.squares.append(random_square(screen_w, screen_h))
and here:
# this will happen once per "day"
if len(self.squares) == 0:

    # fill the list of squares to be drawn
    for second in range(self.max_count):
        self.squares.append(random_square(self.screen_w, self.screen_h))
When it comes time to draw these squares, it also makes that pretty intuitive:
# draw the squares
for square in self.squares:
    rect = (square.x_loc, square.y_loc, self.square_size, self.square_size)
    pygame.draw.rect(self.screen, square.color, rect, 0)
Again, very simple stuff, but worth it to talk about.
I’ll be back at my place that has the Raspberry Pi and display I would like to use for this project, so more on this then.